This evening was the last of six Master Trader Sessions with Matt Gildea. I was just a little late to the start of this class. I had my cat fixed today and the vet was very slow to bring my Wannabe back to me. I ended up waiting 15 minutes for them to bring her out. Needless to say that was frustrating and made me 8 minutes late to my class! When I joined the meeting I came in on him demonstrating Order Entry in OptionsXpress.com
After the order entry we reviewed some current setups and talked about order management, especially stop management. Matt showed us several home builders' charts as they've been a terrific sector to short during the past few months.
After looking through these current market items, we looked at some essential Market Gauges. We began with the "Original Formula" Volatility Index (VXO, $VXO, ^VXO, often just pronounced: vix). This seems to be one of the most powerful leading indicator gauges at our disposal. For much of the past 5 years this has been an excellent tool to measure market sentiment. The best part is it really has demonstrated itself to be a fairly consistent leading indicator of market direction. However, more recently, although it hasn't been completely wrong, it just hasn't given the kind of clear signals it has shown in the past. Since general market sentiment affects stocks, this is a very powerful tool to aid in our decision of an individual stock's direction. Compare the VXO to the DJI, S&P, Nasdaq for the past five years for yourself and see what patterns emerge. Notice how the VXO hasn't moved as dramatically in the more recent past and how the market has similarly not has as dramatic a movement following the VXO's movement?
Although the recent volatility index range has been a bit muted it still follows as a leading indicator if you squint with one eye and turn your monitor sideways. No, just kidding, I was checking to see if you are still paying attention. It seems that all indicators must be continually reevaluated for their applicability to current market. Although this may seem to invalidate them, I think we'd be throwing the baby out with the bathwater if we took that approach. By keeping an open mind to a different interpretation of these indicators, we can still find use of these to aid our decision making on any given position. I may be reading too much into this, and the above account isn't exactly echoed from what I've been taught. It's my own interpretation of what has been presented to me. You've been warned.
After looking at the vix, we went through some guidelines on managing a gap open on our setup as well as how to manage gaps on our open positions. Some of this information requires that you are able to be in front of your computer making market decisions in realtime during the opening minutes of the market. Not exactly day trading, but certainly some strategies involve a similar discipline.
We then turned our attention to Relative Strength & Weakness stocks. Determining relative strength & relative weakness for a given stock is yet another way for us to support our opinion on a stock's direction. This is a multilevel filtering technique we apply where we compare the stock to the market as a whole (an index, such as the S&P 500), and the specific sector. It does make sense that you'd want to put your money into the strongest performers of a given sector that is ideally the strongest performing sector at that point in time (or reverse that for bearish or short-sale). I think this is a very important aspect that I will include in my analysis of an individual stock. It's not the easiest thing to analyze, but I think the benefits far outweigh the time cost.
Matt Gildea then spoke about what the daily routine of a professional trader is. You may have already picked up on this being a discipline that requires daily attention, but this point really can't be stated strongly enough. This is not something that you can expect to get tremendous results by doing it as a hobby, there is a daily routine that you really requires some time. You must be aware of the current market environment, pay attention to news reports, maintain your watchlist, continually be looking for new positions to open and manage the existing positions. It probably means a couple hours a night with some attention paid to the market just before it opens and ideally checking on your open positions as the day progresses to evaluate if any of your stops should be updated.
After having all this information spinning around in my head, it's going to take some practice to get it all down. Right now I'm moving a little on the slow side in terms of analysis & finding trades that I'd want to put my money into. I'm practicing the daily ritual with my paper trades, but there is quite a lot of analysis and things to consider. Patience and keeping a cool head seem to be vital to success.
Showing posts with label Master Trader. Show all posts
Showing posts with label Master Trader. Show all posts
Tuesday, July 18, 2006


Tuesday, July 11, 2006
Master Trader Session 5
Our second-to-last session of Wealth Intelligence Academy's Master Trader live online course taught by Matt Gildea began with a review of our last session from 2 weeks ago. If you recall, we looked at the Bull Pullback Long and the Bear Rally Short. Included in both the first time I took the class and on the retake (due to technical difficulties with the first class), were descriptions of how a short sale works. If the selling short is still a difficult concept, take a look at my Master Trader Session 4 posts. Hopefully one of the two descriptions will clear it up for you.
Entering a trade is only half the battle, possibly the easier half. After all, you can get fairly clear signals on a chart that sets up a good entry for a high probability trade, but what signals can we use to get out? If we don't get out at the right time, we can easily give back all our gains. In previous sessions we've talked about setting our stop loss at the prior day's low as a way to manage the trade. This is a fairly effective management strategy, but often times we'll get stopped out short of the full move because we don't give the stock enough "wiggle" room. Loosening up our stop (stop-loss) will give the stock a bit more freedom to continue the trend, but will also expose the position to greater risk. It's always a balancing act between reward and risk. The cool part about taking control of your trades is that you can tailor your trading style to agree with your risk tolerance.
Managing the trade is also more dynamic than entering the trade. Consider a particularly strong day's movement where the stock increases nearly half of the move that we expect -- say it moves up $3 and our initial target is for a $6 total increase. If we stick with the stop-loss at the prior day's low we leave a lot of room to lose the gains we just picked up. In this case, we probably want to adjust our stop up a little tighter to lock in those gains. Even if we get stopped out, at least it will be for a reasonable profit.
One strategy for exiting the trade is to do so in 2 stages. In the first stage we will likely close out half of the position we hold while we let the other half "ride." If we're not interested in a Position Trade, we may choose close out the position entirely. Naturally this means we'll set our stop a bit tighter for the first stage.
We were given the following strategies for Stage 1 (Swing Trades):
After looking at the exit strategies we looked at a the following additional setups: High Base Breakout, Low Base Breakdown Short, Ascending (Descending) Triangle Breakout (Breakdown), and the Symmetrical Triangle Breakout (Breakdown). These are similar to the Pullback Tactics we've already studied, but are more of a consolidation pattern compared to the Pullback Long or Rally Short. I will offer this additional clue: the 2/5 EMA crossover often yields good results when applied to one of these consolidation tactics.
If you're finding all this confusing, don't worry, I'm leaving out a lot of details. If you're truly interested, signup for the class and get the full story instead of my generalized digest version. Tell them Mark Jones sent you... Are you reading this TMTT/EduTrades? I want a commission! ;-)
Entering a trade is only half the battle, possibly the easier half. After all, you can get fairly clear signals on a chart that sets up a good entry for a high probability trade, but what signals can we use to get out? If we don't get out at the right time, we can easily give back all our gains. In previous sessions we've talked about setting our stop loss at the prior day's low as a way to manage the trade. This is a fairly effective management strategy, but often times we'll get stopped out short of the full move because we don't give the stock enough "wiggle" room. Loosening up our stop (stop-loss) will give the stock a bit more freedom to continue the trend, but will also expose the position to greater risk. It's always a balancing act between reward and risk. The cool part about taking control of your trades is that you can tailor your trading style to agree with your risk tolerance.
Managing the trade is also more dynamic than entering the trade. Consider a particularly strong day's movement where the stock increases nearly half of the move that we expect -- say it moves up $3 and our initial target is for a $6 total increase. If we stick with the stop-loss at the prior day's low we leave a lot of room to lose the gains we just picked up. In this case, we probably want to adjust our stop up a little tighter to lock in those gains. Even if we get stopped out, at least it will be for a reasonable profit.
One strategy for exiting the trade is to do so in 2 stages. In the first stage we will likely close out half of the position we hold while we let the other half "ride." If we're not interested in a Position Trade, we may choose close out the position entirely. Naturally this means we'll set our stop a bit tighter for the first stage.
We were given the following strategies for Stage 1 (Swing Trades):
- Upper Channel Line: Draw in an upper channel line along the peaks and when the stock moves into the "retail" price either tighten up the stop or simply close the position.
- Reversal Candle: Look for one of the many reversal candle patterns and tighten up the stop or close.
- Prior Day Low: Probably the simplest management strategy -- simply update your stop at the end of each trading day.
- Prior Resistance: If there's significant prior resistance we may want to close as the stock comes into an area of prior resistance. This could simply be our initial target for the move and it may be wise to tighten up our stop to squeeze it for the reward we originally sought to capture.
- Swing Low Violation: If the swing low drops out of the trend it may be a good time to close.
- Daily MACD Divergence: If the MACD crosses itself we may be seeing the end of the trend.
- Major Resistance: If we find the stock in an area of past resistance, especially tested resistance, we probably want to exit.
- Weekly Reversal: Weekly reversal candlestick patterns may be an indicator for a timely exit; however, you're probably better off managing this off the daily chart, follow the normal swing lows and adjust the stop.
After looking at the exit strategies we looked at a the following additional setups: High Base Breakout, Low Base Breakdown Short, Ascending (Descending) Triangle Breakout (Breakdown), and the Symmetrical Triangle Breakout (Breakdown). These are similar to the Pullback Tactics we've already studied, but are more of a consolidation pattern compared to the Pullback Long or Rally Short. I will offer this additional clue: the 2/5 EMA crossover often yields good results when applied to one of these consolidation tactics.
If you're finding all this confusing, don't worry, I'm leaving out a lot of details. If you're truly interested, signup for the class and get the full story instead of my generalized digest version. Tell them Mark Jones sent you... Are you reading this TMTT/EduTrades? I want a commission! ;-)
Thursday, June 29, 2006
Master Trader Session 4 (retake)
Because of the technical difficulties I experienced on Tuesday night's Master Trader Session 4, I contacted Tricia Moore (my coordinator for the Master Trader course) and she connected me in to the Thursday night session. Fortunately it's taught by Matt Gildea, is on the same session this week, and I was able to rearrange my schedule to make it work.
Tonight's retake of the class was without technical problems. It was particularly interesting because of how the market reacted to the Federal Reserve's interest rate increase. You might even say it was a benefit to have the Tuesday night class have such trouble, just so I could retake it after the Fed announcement.
The rally the market experienced today did manage to knock out almost all good Bear Rally Short setups, so we didn't get to see too many live examples. However, it was really great to hear Matt's take on this event. It brings to light one particular advantage an individual trader can use: we don't have to trade. If we're not seeing any good setups for a trade, whether it be an Option Strategy, long or short position. We can wait for the setup to improve.
Tonight Matt gave a different example for selling short, and I think now that I've been exposed to it using so many different examples and in so many different concepts, I definitely get it. For your benefit I'll give tonight's example too. Matt decided that, while he was in town, he'd borrow Jennifer's super-sporty fun car. As Matt was driving around a gentleman in a limousine rolled down his window at a stoplight and said "I like your car, how much?" Matt knew from a previous conversation that Jennifer paid $30k for it. Since Matt is quite the entrepreneur, rather than explaining that it's not his car, he replies with an outrageous number: $50k. The man in the limo counts out $50k and Matt hands over the car. Now Matt is now short one super-sporty fun car, but he has $50k which he can use to purchase a new car to give back to Jennifer. He's expecting that he can go to the super-sporty fun car dealership and purchase a new fun car for $30k and he walks away with a nice $20k profit. Of course, it could be that Jennifer just happened to get a really great deal on her super-sporty fun car and the dealership wants $60k. If the dealership wants $60k Matt will have to come up with $10k out-of-pocket to cover the difference.
I covered most of what the session was about in the previous posting: Master Trader Session 4. This time it was just much easier to follow along because I didn't have any trouble seeing the visual cues for which Matt referred.
Tonight's retake of the class was without technical problems. It was particularly interesting because of how the market reacted to the Federal Reserve's interest rate increase. You might even say it was a benefit to have the Tuesday night class have such trouble, just so I could retake it after the Fed announcement.
The rally the market experienced today did manage to knock out almost all good Bear Rally Short setups, so we didn't get to see too many live examples. However, it was really great to hear Matt's take on this event. It brings to light one particular advantage an individual trader can use: we don't have to trade. If we're not seeing any good setups for a trade, whether it be an Option Strategy, long or short position. We can wait for the setup to improve.
Tonight Matt gave a different example for selling short, and I think now that I've been exposed to it using so many different examples and in so many different concepts, I definitely get it. For your benefit I'll give tonight's example too. Matt decided that, while he was in town, he'd borrow Jennifer's super-sporty fun car. As Matt was driving around a gentleman in a limousine rolled down his window at a stoplight and said "I like your car, how much?" Matt knew from a previous conversation that Jennifer paid $30k for it. Since Matt is quite the entrepreneur, rather than explaining that it's not his car, he replies with an outrageous number: $50k. The man in the limo counts out $50k and Matt hands over the car. Now Matt is now short one super-sporty fun car, but he has $50k which he can use to purchase a new car to give back to Jennifer. He's expecting that he can go to the super-sporty fun car dealership and purchase a new fun car for $30k and he walks away with a nice $20k profit. Of course, it could be that Jennifer just happened to get a really great deal on her super-sporty fun car and the dealership wants $60k. If the dealership wants $60k Matt will have to come up with $10k out-of-pocket to cover the difference.
I covered most of what the session was about in the previous posting: Master Trader Session 4. This time it was just much easier to follow along because I didn't have any trouble seeing the visual cues for which Matt referred.
Tuesday, June 27, 2006
Master Trader Session 4
Tonight's session concentrated on 3 tactics. We started with a review of last week's Swing Bull Pullback Long. We also added the Weekly Bull Pullback Long, which is just like the swing time-frame trade in terms of technical setup, but rather than using a daily chart, we'd look at a weekly chart instead. One extra concern with the Weekly Bull Pullback is paying attention to earnings. Of course earnings reports are important with the Swing Bull Pullback too and it's not recommended to enter into such a trade with an imminent earnings report or other news that would affect the volatility and risk of the trade.
After wrapping up the discussion of the above Bull strategies Matt Gildea explained the Short Sale. I've been on the verge of understanding how selling short works, but never quite got it until hearing Matt describe it using the George Foreman Grill example. When you order a George Foreman Grill from a TV commercial, you'll notice that you should allow 8-10 weeks for delivery. This is because they don't have any set number of the product sitting around in a warehouse. It's likely they don't have any on hand at all, but they know they can have it manufactured and delivered within 8-10 weeks. So, basically the commercial is selling this product short because they're selling something they don't currently have. Unlike stocks, they probably know precisely what the cost per unit will be, and so they know what their profits will be. The same ability to sell something you don't have is available in the stock market. In this case you're selling before buying, with the goal of selling high and buying low. You loan the sold stocks (short sale) from your broker and then buying them back, hopefully at a lower price. I hope that example helps you as much as it helped me.
Before explaining how the short sale works Matt demonstrated entering a stop-limit trade on Options Xpress. Unfortunately my computer froze in the middle of this demonstration, and I couldn't reconnect in time to see all but the start. That's ok, as I've used Options Xpress for paper trading already, so I'm at least a little familiar with their site and the way to place a stop-limit.
It wasn't just my computer that had a problem for this session. Matt Gildea, our presenter, was having trouble with his local connection. He was giving the presentation from Chicago, and has done so without issue in the past, however this evening there were multiple interruptions in the presentation. The end result of these problems left me staring at blank screens most every time Matt moved the presentation forward. It seems that I was the last on the update list with WebEx. Needless to say, staring at a blank page while listening to visual cues being described was exceedingly frustrating. Being the computer nerd that I am, I looked into how WebEx connects and discovered that I may benefit from forwarding a port on my router (TCP port 1270, if you're interested). WebEx does tunnel through port 80 using HTTP, so it's not required, but it may improve the connection speed for me. I've contacted Tricia Moore, my coordinator for the Master Trader course to see if any make-up can be arranged.
It just wasn't Matt's night, as he was suffering from the remnants of a cold. His 35th birthday is this Friday, and although that's not really a bad thing, it must not be pleasant to be ill for such an event. Hopefully he'll be feeling better by Friday. Say it with me: Happy Birthday Matt!!
Not to harp on it, but it was particularly frustrating to have these interruptions with the presentation, especially given that this session was most appropriate for the current Bearish market condition. We did go through many examples of Swing Bear Rally Short tactic trades and since they're essentially just the inversion of the Swing Bull Pullback Long, I don't think it was a total loss, just frustrating. I think Matt did well to convey much of the information, even during the periods of time that his connection did not allow him to manage the presentation.
To wrap things up we were going to look at some live examples of bearish trades; unfortunately, due to the technical difficulties, Matt gave us the list of about a dozen stocks he identified but was unable to point out the setups visually with us. All of us as students need to do our homework now and take a look at the stocks that he picked for demonstrating the Swing Bear Rally Short tactic. Aside from just giving us some stocks to look at, Matt pointed out how to do our own scans using Trade Seeker to identify likely candidates for ourselves.
All in all, a frustrating evening, but not fruitless. It truly seemed to be an exceptional evening of technical difficulties. The previous 3 sessions were not fraught with such problems, so please don't interpret this as "normal" operations. Stay tuned, hopefully future sessions will go as smoothly as previous.
After wrapping up the discussion of the above Bull strategies Matt Gildea explained the Short Sale. I've been on the verge of understanding how selling short works, but never quite got it until hearing Matt describe it using the George Foreman Grill example. When you order a George Foreman Grill from a TV commercial, you'll notice that you should allow 8-10 weeks for delivery. This is because they don't have any set number of the product sitting around in a warehouse. It's likely they don't have any on hand at all, but they know they can have it manufactured and delivered within 8-10 weeks. So, basically the commercial is selling this product short because they're selling something they don't currently have. Unlike stocks, they probably know precisely what the cost per unit will be, and so they know what their profits will be. The same ability to sell something you don't have is available in the stock market. In this case you're selling before buying, with the goal of selling high and buying low. You loan the sold stocks (short sale) from your broker and then buying them back, hopefully at a lower price. I hope that example helps you as much as it helped me.
Before explaining how the short sale works Matt demonstrated entering a stop-limit trade on Options Xpress. Unfortunately my computer froze in the middle of this demonstration, and I couldn't reconnect in time to see all but the start. That's ok, as I've used Options Xpress for paper trading already, so I'm at least a little familiar with their site and the way to place a stop-limit.
It wasn't just my computer that had a problem for this session. Matt Gildea, our presenter, was having trouble with his local connection. He was giving the presentation from Chicago, and has done so without issue in the past, however this evening there were multiple interruptions in the presentation. The end result of these problems left me staring at blank screens most every time Matt moved the presentation forward. It seems that I was the last on the update list with WebEx. Needless to say, staring at a blank page while listening to visual cues being described was exceedingly frustrating. Being the computer nerd that I am, I looked into how WebEx connects and discovered that I may benefit from forwarding a port on my router (TCP port 1270, if you're interested). WebEx does tunnel through port 80 using HTTP, so it's not required, but it may improve the connection speed for me. I've contacted Tricia Moore, my coordinator for the Master Trader course to see if any make-up can be arranged.
It just wasn't Matt's night, as he was suffering from the remnants of a cold. His 35th birthday is this Friday, and although that's not really a bad thing, it must not be pleasant to be ill for such an event. Hopefully he'll be feeling better by Friday. Say it with me: Happy Birthday Matt!!
Not to harp on it, but it was particularly frustrating to have these interruptions with the presentation, especially given that this session was most appropriate for the current Bearish market condition. We did go through many examples of Swing Bear Rally Short tactic trades and since they're essentially just the inversion of the Swing Bull Pullback Long, I don't think it was a total loss, just frustrating. I think Matt did well to convey much of the information, even during the periods of time that his connection did not allow him to manage the presentation.
To wrap things up we were going to look at some live examples of bearish trades; unfortunately, due to the technical difficulties, Matt gave us the list of about a dozen stocks he identified but was unable to point out the setups visually with us. All of us as students need to do our homework now and take a look at the stocks that he picked for demonstrating the Swing Bear Rally Short tactic. Aside from just giving us some stocks to look at, Matt pointed out how to do our own scans using Trade Seeker to identify likely candidates for ourselves.
All in all, a frustrating evening, but not fruitless. It truly seemed to be an exceptional evening of technical difficulties. The previous 3 sessions were not fraught with such problems, so please don't interpret this as "normal" operations. Stay tuned, hopefully future sessions will go as smoothly as previous.
Tuesday, June 20, 2006
Master Trader Session 3
In this session, the third of six, Matt Gildea began talking tactics. Before we looked at today's high probability swing trade set-ups (tactics), we covered Chaikin Money Flow and Averiage Directional Indicator (ADX) -- both are secondary technical indicators.  We also studied ideal uptrend (and downtrend) characteristics as well as a system for determining the outlook.
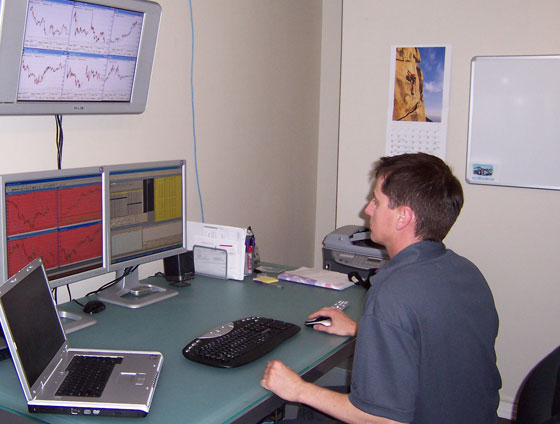
Matt also gave us a peak into his office (pictured on the right). I don't know about you, but I'm getting a case of display envy!
We began this evening's session with Chaikin Money Flow (CMF), one of Matt's favorite secondary indicators that is a practical tool for confirming swing highs in uptrends and swing lows in downtrends. Because CMF is a volume based indicator, it is particularly useful in showing us the buying or selling "pressure" (remember what we learned about volume in Master Trader Session 2).
Adding to our arsenal of indicators, we learned about the Average Directional Indicator (ADX) which is a great tool for measuring the strength of a trend. ADX is particularly suited as something to aid in determining when to exit a trade. Similarly, it's quite good for tightening up our stop (stop loss).
At this point in time we have a lot of indicators -- various Moving Averages, MACD, Stochastics, ADX, CMF -- from which to identify ideal uptrends and downtrends. They are also useful in determining our outlook, which can be from Extremely Bullish, Bullish, Bullish to Neutral-Stagnant, Neutral-Stagnant, Bearish to Neutral-Stagnant, Bearish, to
Extremely Bearish. Quite honestly these outlooks are obvious enough, but consider how valuable this information is when applying it to a specific stock, when attempting to capture the swing movements with the trend. The aforementioned outlooks can be applied in a top-down manner to aid in determining what kinds of trades or option strategies we would like to employ for the highest probability and reward/risk ratio. This top-down method of determining the outlook means scoring the market as a whole -- by looking at broad indices such as SPY, QQQ, and DIA -- as well as scoring the sector, and eventually the individual stock. Although we're given great rules to determine the outlook, it becomes a subjective task. For example, it will be extremely rare when all the criteria is met for an Extremely Bearish outlook. Generally some aspects will show as Bearish to Neutral-Stagnant or even Neutral-Stagnant, while other aspects may be showing a solidly Bearish trend.
And finally, after being steeped in indicators and general chart reading skils, we have enough knowledge to contextualize our tactics. Today we looked at the price correction Swing Bull Pullback Long. This tactic takes advantage of a stock's natural tendency to have price correction pullbacks during an uptrend. These tend to occur because of profit taking; traders sell at swing highs in order to lock in profit. We looked at this as a powerful setup for entry into a trade and covered how to place a stop-limit order based on the stock's movement. We also discussed one strategy for placing out stop (stop loss) for exiting the trade.
Unfortunately, in the current bearish market, we were unable to have a solid example in the live market. Honestly, this makes sense and we wouldn't be looking to enter a Bullish trade in a Bearish market, unless we had a stock (hopefully in a Bullish sector) that was truly outperforming the market.
Next session begins our shorting tactics. If the market continues its bearish trend we could have plenty of examples for a Swing Bear Rally Short. Until then, thanks for taking an interest in my blog, I hope you're finding what I have to useful and (hopefully) entertaining.
 We also studied ideal uptrend (and downtrend) characteristics as well as a system for determining the outlook.
Matt also gave us a peak into his office (pictured on the right). I don't know about you, but I'm getting a case of display envy!
We began this evening's session with Chaikin Money Flow (CMF), one of Matt's favorite secondary indicators that is a practical tool for confirming swing highs in uptrends and swing lows in downtrends. Because CMF is a volume based indicator, it is particularly useful in showing us the buying or selling "pressure" (remember what we learned about volume in Master Trader Session 2).
Adding to our arsenal of indicators, we learned about the Average Directional Indicator (ADX) which is a great tool for measuring the strength of a trend. ADX is particularly suited as something to aid in determining when to exit a trade. Similarly, it's quite good for tightening up our stop (stop loss).
At this point in time we have a lot of indicators -- various Moving Averages, MACD, Stochastics, ADX, CMF -- from which to identify ideal uptrends and downtrends. They are also useful in determining our outlook, which can be from Extremely Bullish, Bullish, Bullish to Neutral-Stagnant, Neutral-Stagnant, Bearish to Neutral-Stagnant, Bearish, to
Extremely Bearish. Quite honestly these outlooks are obvious enough, but consider how valuable this information is when applying it to a specific stock, when attempting to capture the swing movements with the trend. The aforementioned outlooks can be applied in a top-down manner to aid in determining what kinds of trades or option strategies we would like to employ for the highest probability and reward/risk ratio. This top-down method of determining the outlook means scoring the market as a whole -- by looking at broad indices such as SPY, QQQ, and DIA -- as well as scoring the sector, and eventually the individual stock. Although we're given great rules to determine the outlook, it becomes a subjective task. For example, it will be extremely rare when all the criteria is met for an Extremely Bearish outlook. Generally some aspects will show as Bearish to Neutral-Stagnant or even Neutral-Stagnant, while other aspects may be showing a solidly Bearish trend.
And finally, after being steeped in indicators and general chart reading skils, we have enough knowledge to contextualize our tactics. Today we looked at the price correction Swing Bull Pullback Long. This tactic takes advantage of a stock's natural tendency to have price correction pullbacks during an uptrend. These tend to occur because of profit taking; traders sell at swing highs in order to lock in profit. We looked at this as a powerful setup for entry into a trade and covered how to place a stop-limit order based on the stock's movement. We also discussed one strategy for placing out stop (stop loss) for exiting the trade.
Unfortunately, in the current bearish market, we were unable to have a solid example in the live market. Honestly, this makes sense and we wouldn't be looking to enter a Bullish trade in a Bearish market, unless we had a stock (hopefully in a Bullish sector) that was truly outperforming the market.
Next session begins our shorting tactics. If the market continues its bearish trend we could have plenty of examples for a Swing Bear Rally Short. Until then, thanks for taking an interest in my blog, I hope you're finding what I have to useful and (hopefully) entertaining.
Tuesday, June 13, 2006
Master Trader Session 2
Matt Gildea presented again tonight for the Wealth Intelligence Academy'sTM Advanced Training Course: Master TraderTM Session 2; see: super-official overly long full name ;-). Why did I take all the time to write that out? Because I'm not taking any shortcuts on this blog :). You're getting the full unadulterated experience in all it's glory. Now, where was I? Oh yes...
Matt started by sharing a few downloads. A couple were images that showed how to link up Trade SeekerTM scans and alerts directly into The Trade CenterTM software. Very cool. Another neat trick he showed us was: how to link active charts in order to view the same stock over different time spans at once. Even cooler. Also included in the downloads was an Excel Spreadsheet that gives you some numbers on positions: Reward/Risk Ratio, % of Account Invested In Trade, Gain at Basic Investment Target (%), Loss at Initial Stop ($). All quite essential things to know before entering a trade, don't you think?
Today's session is still on the analysis side of chart reading. We learned about the following Moving Averages: 20, 50, and 200 Simple MA as well as the 13 Exponential MA. These were introduced as useful guides to support and resistance, help to identify the dominant trend and a stock's momentum. We looked at how combining these MAs can help us identify ranges and timing for entry or exit for a trending stock.
After those primary indicators we looked at how Volume comes in to the picture. A cool way that it was explained is:
If PRICE ACTION shows us whether a stock is hot, cold or lukewarm ("thermometer"), VOLUME shows us the buying or selling pressure at any given price level ("barometer").
It also often indicates where the "big money" is moving. An important issue related to volatility is liquidity. Liquidity is import for a couple reasons: 1) basically, slippage is a lack of liquidity on a low volume stock ("thinly traded"), where the fill price will vary from what you hoped because your order affects the price of the stock more than higher volume stocks. This is because there aren't enough other trades on the stock to allow the market to trade the stock at such a fine granularity. That was a mouthful. I'm sure someone else has stated it more simply, but that's how my brain interpreted and spit out what it learned. 2) Above average volume can be used to help determine if a trend is likely to continue (again, following the barometer, or how much "pressure" was behind the direction).
We then turned our attention to Gaps and how they can be used to determine energy, sentiment, and emotion. We studied the following kinds of gaps: Filled, Open, Breakaway, Exhaustion and Catastrophic. Each of the above imply different things about the gap -- how to interpret a gap based on it's specific movement.
After those aforementioned Primary Indicators, we looked at the Stochastic and MACD (Moving Averages Convergence/Divergence) Secondary Indicators and how they are used as additional signals or confirmations. They're known as secondary indicators because they are derived from the Primary Technical Indicators of stock price and volume. We learned how events on these can be leading or lagging signals based on the recent stock movement. Depending on the event shown in the indicator and the recent stock direction, we can interpret the signal and make higher probability trades. Both the Stochastic and the MACD are clear signals that help smooth out the "noise" of the day-to-day price action and can, under certain circumstances, be used as leading signals, however they don't give an exact entry price, and often give incorrect & lagging signals in many circumstances.
Both Primary and Secondary Indicators are to help us interpret & support which direction we think the stock may go: up, down or sideways. It's another bit of information to support what kind of trade we may want to enter or know when to exit.
Next session we will continue with Chaikin Money Flow and Average Directional Indicator. What's really exciting is that after we get these basic technical indicators and how to interpret them out of the way, we can begin to look at setups and how to apply all of the information to help us place high probability trades.
Tuesday, June 06, 2006
Master Trader Session 1
Today was my first live online course with the Wealth Intelligence Academy (EduTrades/Teach Me To Trade). It was the first of six sessions of the Advanced Training course known as "Master Trader".
Matt Gildea, the presenter for the entire course, began with a brief history about himself as a trader. He worked as a broker for a while before becoming a day trader in April 2000. At a glance, to the uneducated, it looked like he would have lost everything during the long downtrend from that all time high. What perfect timing, no? Actually, thanks to the guidance of his mentor, he did quite well.
We covered the difference between Fundamentals and Technicals and the roles and values of each. In short, Technical data is the information about a stock's movement including volatility and price changes, whereas Fundamentals have to do with the underlying company information including price to earnings ratio, officers, etc... Both technicals and fundamentals are valuable sources of information and aid in making decisions on which stocks to trade and when to enter and exit. The difference is that fundamentals tend to be more valuable for long term investing; when talking about day trading or swing trading, technicals are more valuable in figuring out the probability of the future stock movement.
One thing strongly emphasized is that we use technicals and fundamentals to asses the probability of a particular stock's movement, not to predict the future. The probability is based on a number of factors, such as technical indicators and things like the stock crossing a major moving day average, etc... We'll get into more of this sort of analysis in future sessions.
Today's session was an introduction chart reading. We went over how to read candlestick charts and identified the following candlestick reversal patterns:
That's the quick-and-dirty description of the first session -- OK, not so quick, but it was a 3 hour class!
Matt Gildea, the presenter for the entire course, began with a brief history about himself as a trader. He worked as a broker for a while before becoming a day trader in April 2000. At a glance, to the uneducated, it looked like he would have lost everything during the long downtrend from that all time high. What perfect timing, no? Actually, thanks to the guidance of his mentor, he did quite well.
We covered the difference between Fundamentals and Technicals and the roles and values of each. In short, Technical data is the information about a stock's movement including volatility and price changes, whereas Fundamentals have to do with the underlying company information including price to earnings ratio, officers, etc... Both technicals and fundamentals are valuable sources of information and aid in making decisions on which stocks to trade and when to enter and exit. The difference is that fundamentals tend to be more valuable for long term investing; when talking about day trading or swing trading, technicals are more valuable in figuring out the probability of the future stock movement.
One thing strongly emphasized is that we use technicals and fundamentals to asses the probability of a particular stock's movement, not to predict the future. The probability is based on a number of factors, such as technical indicators and things like the stock crossing a major moving day average, etc... We'll get into more of this sort of analysis in future sessions.
Today's session was an introduction chart reading. We went over how to read candlestick charts and identified the following candlestick reversal patterns:
- The Doji - the stock closes where it opens it matters not how much upper or lower shadow shows up. Not a reversal candlestick when there is no clear trend leading up to it.
- Bullish & Bearish Engulfing - the main body of the candlestick engulfs the previous day's candlestick
- The Hammer - during a downtrend, the stock sells off during the day but closes higher than it opens, leaving a long lower shadow with a small main body.
- The Hanging Man - during an uptrend, the stock sells off during the day but closes just slightly lower than it opens, leaving a long lower shadow with a small main body, much like a Hammer candlestick.
- Bullish & Bearish Harami - the inversion of an engulfing pattern; the body of the candlestick will fit into the previous day's candlestick.
- The Shooting Star - similar to the Hanging Man except with a long upper shadow.
- Dark Cloud Cover - during an uptrend, the stock gaps up and sells off to a point lower than the midpoint of the previous day's candlestick body.
- The Piercing Line - the opposite of Dark Cloud Cover
- The High Wave - after a multi-day uptrend, this is a bearish candle that has very long upper and lower shadow with a relatively small main body.
That's the quick-and-dirty description of the first session -- OK, not so quick, but it was a 3 hour class!
Subscribe to:
Posts (Atom)