Tuesday, August 22, 2006

Soon-To-Be TMTT Student Email

On 8/22/06, Jim* wrote:
Mark,
Boy am I glad I stumbled across your post.
I went to the TMTT 3 day seminar, but found myself
very skeptical about dropping the kind of money they
wanted (especially since I've recently beeen victim of a corporate downsize), even though I found myself interested
in the course. (maybe the Russ Whitney connection was
just too slimy for me).
Anyway, I was looking for anyone who had experience
with TMTT, and thank God, you popped up.
I wish you nothing but the best of luck (probably for some selfish reasons - so I'll feel safe buying the course the next time they're in town). Keep up the great work, and thanks for the honesty.

Jim*

You're welcome... the blog's a lot of work, but I know I'm helping others make more informed decisions. I know I'd like to have seen something like my blog when I was signing up for courses. If you're really interested in trading for a living I'm finding The Complete Trading for a Living by Dr. Alexander Elder to be very useful and is probably a good place to start, even before any TMTT classes (and it's only $40, including the study guide in a leather bound edition, I bought the study guide separately and spent more!). Add what's commonly known as the Technical Analysis and Options "Bibles": Technical Analysis of the Financial Markets by John J. Murphy and Options as a Strategic Investment by Lawrence G. McMillan, and you'll have a head start on trading and be even more prepared for what TMTT can teach you.

Best of Luck and Diligence!

Mark

*Name changed to protect the presumed innocent.

Monday, August 21, 2006

Study of Market Charts

As part of my technical analysis for trading I take some time, at least once a week, to study the board market indexes. It's a known phenominon that an individual stock's direction is heavily influenced by the general market direction. Cliches like "a rising tide lifts all boats" are quite applicable. I've drawn some trend lines and key support and resistance in the following charts to help guide my eyes. This technical analysis is based on what I've learned from Teach Me To Trade as well as Technical Analysis of the Financial Markets by John J. Murphy. I'll attempt to identify the source as I explain what I've drawn in, etc...

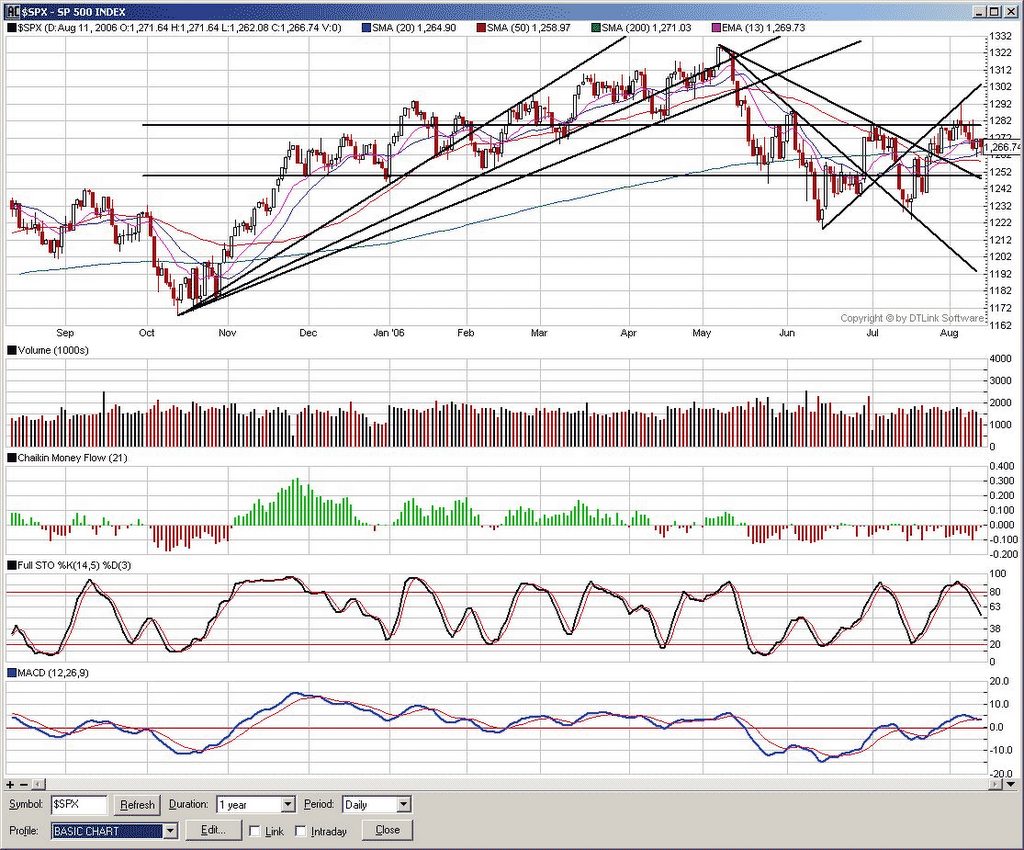
On the right is my analysis of the S&P 500 10 days ago (August 11, 2006). I drew in the 3 ascending trendlines following the Fan pattern that Murphy describes in his book. Another idea that Murphy brings to light is 2/3 retrace. Simply stated: we can expect a 1/3 retrace from the low to the high, however if we fall through that we may find support at 1/2 way down from the peak, and after that 2/3 way down. What you'll notice on the S&P 500 over the last year matches this pattern pretty well. Notice that there's basically 150 points between the low in October to the high in early May. Interestingly enough, there's a bump at the halfway point on the retrace in mid May. After the market crashed through that level of support it retraced down almost exactly 100 points to find support 2/3 down from the peak to early-to-mid June. Take a really good look at the trendlines I've drawn in. They are initially drawn along the line of support on uptrends and resistance on downtrends, but notice how once the trendline (support) was violated it became resistance. This is especially true of the first trendline for both bottom (uptrend support) & top (downtrend resistance).

Because of this purely technical market analysis, two weeks ago I was expecting the bear market to be weakening and that we may soon see a bull market. At the time of the analysis (August 11) it was not exactly a certainty, and I honestly expected some consolidation before we actually see a true uptrend. However, it has lead me to favor my bulls watchlist for long positions that currently have a good setups, rather than continuing to be weighted towards the bearish side.

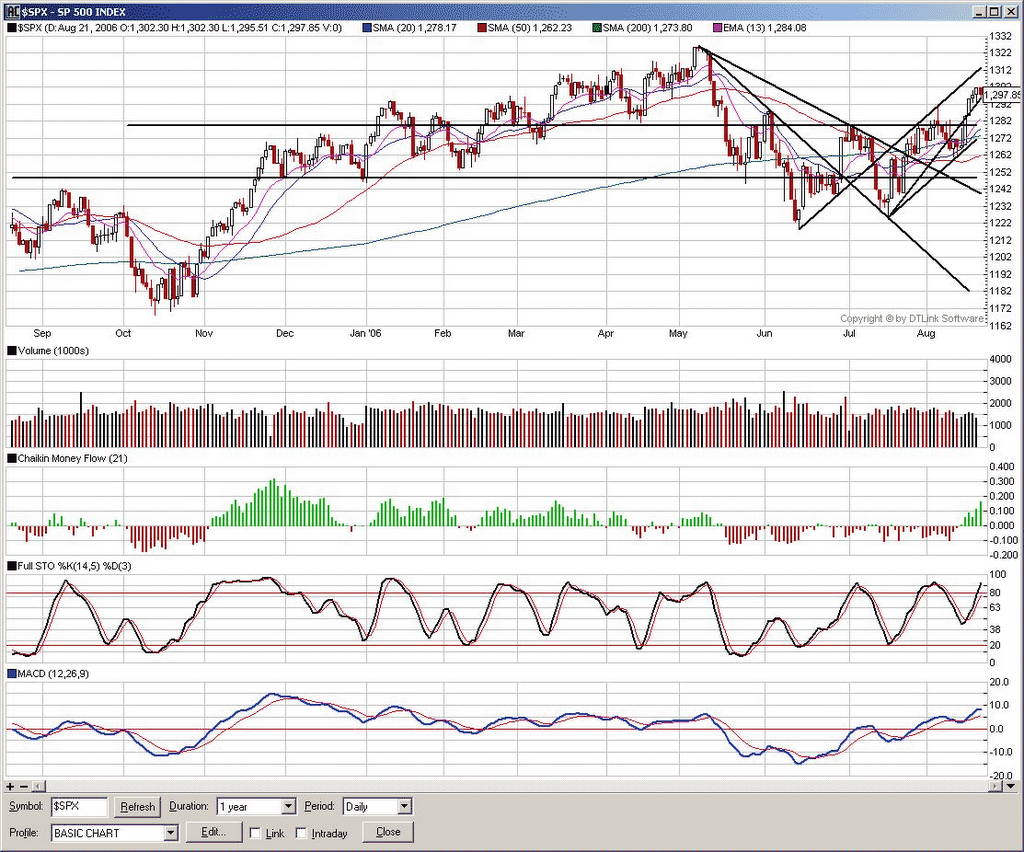
Here's an updated chart for the S&P 500 as of today. I've drawn in all the same forward-looking lines as was in the previous version, adding a couple new trendlines showing current market trend. These are not very well established, and because August's history as being a bad month (August Angst) a great number of people expect it to be the worst month of the year. The S&P 500 has managed to show some signs of predictability, but from a purely technical analysis, it's a time to be cautiously optimistic IMHO.


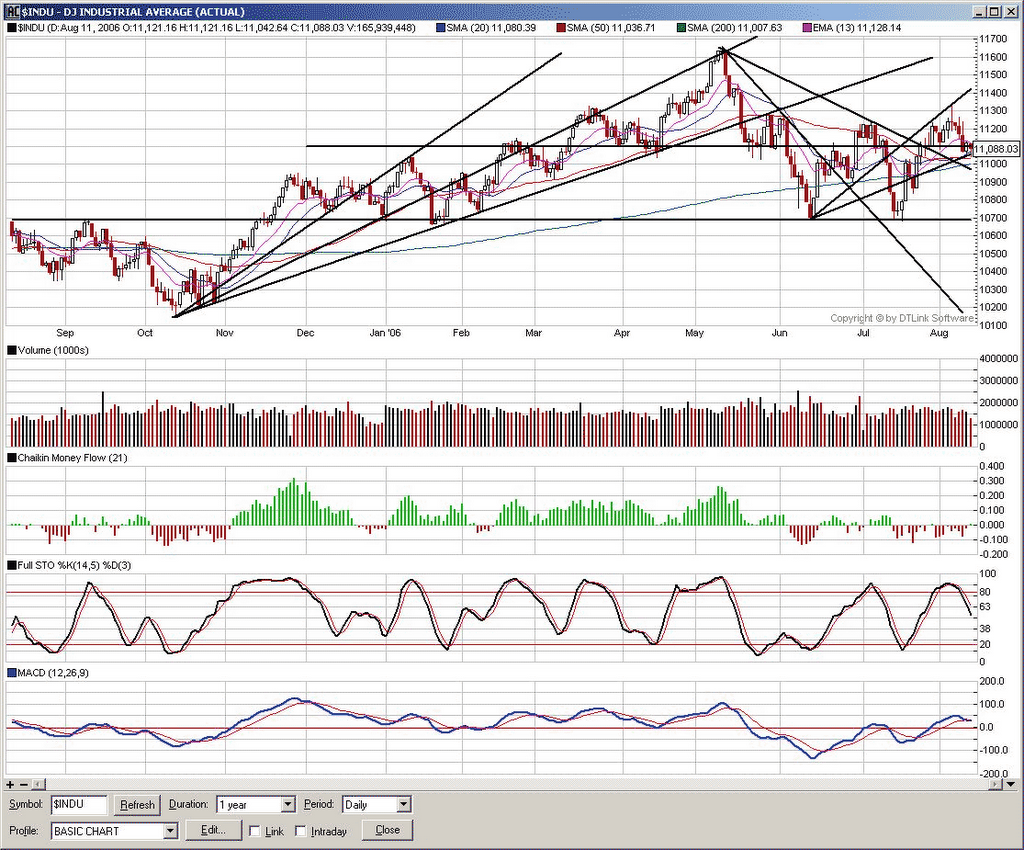
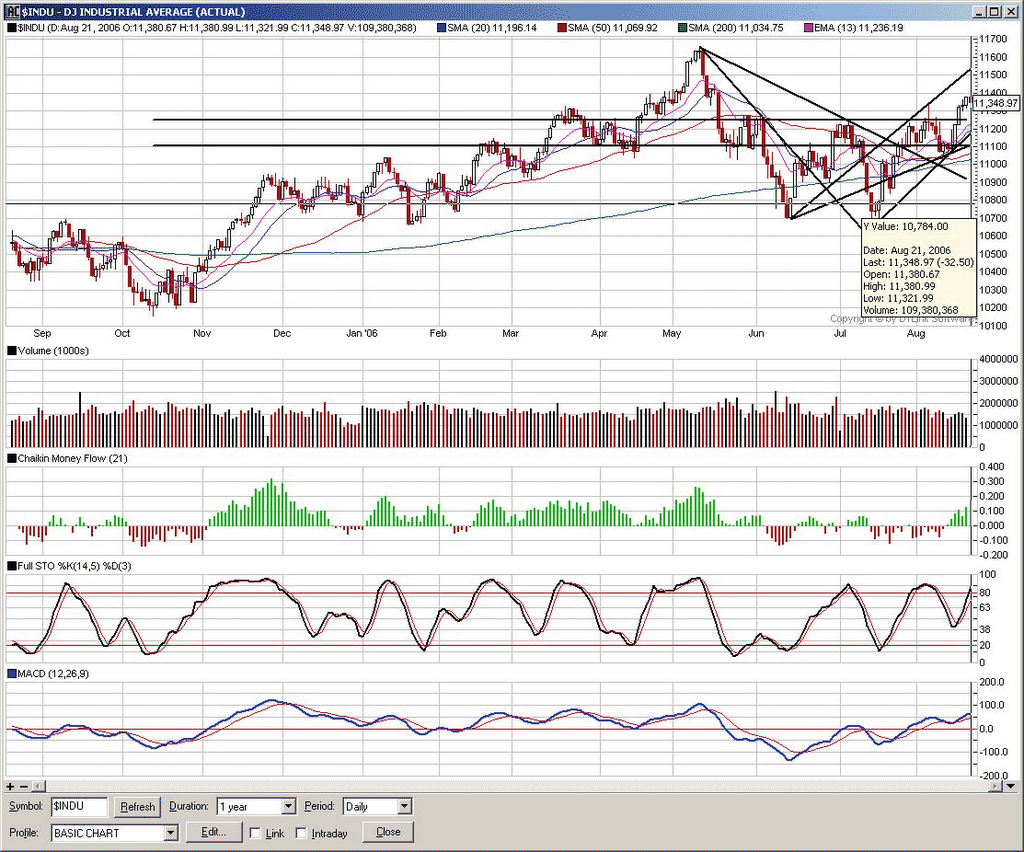
Below is a similar study of the Dow Jones Industrial Average. Notice how many of the same phenomina appear on the DJI as the S&P.


Please consider your source carefully when taking anyone's opinion about the outlook for the markets and/or stocks; after all, if you're taking my interpretation, allow me to remind you that I haven't even placed a trade with real money yet! I just wanted to let you see an example of how I'm looking at the market to help determine my positions. All of the above is only my interpretation & opinion, so be especially skeptical! I hope that in the future I can look back at this post and either 1) be proud of my decent interpretation or 2) laugh about how I could have such an outlook based on the charts because my technical analysis skills are so much better.

This post resembles a trading journal entry in many ways and it is part of my journaling activities. I'll give an example of my trading journal soon. As in music, the best person to learn from is yourself; it does require that you keep a certain detached, honest perspective in order for you to learn from your strengths & weaknesses. In music, the sound you produce is your ultimate goal and a mic is brutally honest and allows you a external perspective of how effective your efforts are. Listening to the playback with an impartial ear is one of the most effective self-teaching tools available. A trading journal is a way of capturing your thoughts, justifications, emotions, etc... at open and close of a trade. It gives you insight into your own trading strengths and weaknesses and thus is a learning tool that's custom tailored to you.

Follow-Up Email About Market Reversals

Here's the follow-up to the previous email question I received about coaching along with my response...

On 8/20/06, Name Blanked Out To Protect the Innocent ;-) wrote:
Thanks for your time to email me back. Are you going to the trading room class. This class really interests me because you can see them trading and do what they are doing. I think I would learn a lot at that one because I'm better at seeing it and doing it, also they say they make a lot of money at that class which would be nice to see some profit. Also the market looks like it just went back into an uptrend and is bullish rather than bearish and trades are harder to find with the switch taking place wondered if you had the same opinion.

I'm highly considering going to the trading room class, but I'd like to have more money in my account when I get there. I'd like to have over $25k in order to avoid the pattern day trading restrictions. I also plan to attend the Advanced Trading P.I.T. The HITS class really has my attention, but I think I'd like to take their Advanced Technical Analysis class first. Well, that and the HITS class requires > $200k in your account to be able to employ the Institutional tactics. My plan isn't set in stone quite yet, and attending a class that isn't offered online is a bit too much of a hardship for me at the moment. I still need my job and the money that pays the bills, and taking off for a few days isn't an option for the next couple months.

There are signs about market reversals. They seem to be slightly clearer on the broad market charts and I'll be posting some of the chart analysis work on the markets to my blog very soon. Basically when you start to see the swing lows (or swing highs) weakening, it's time to reevaluate your market outlook. During such transitional times you can look through your watchlist for the next direction and see if there are any good setups. During such transitional times, you probably need to keep your stop-loss a little looser and accept that additional risk. Certainly the trade can still go against you and a volatile, switching market isn't the easiest to navigate, but you have the potential for some nice reward. Simply being a sheep and only following the trend isn't necessarily the best way either although it's "safer" if you really wait for the stock to come to you and pay attention to reversal signs (weakening swing highs/lows, exhaustion gaps, extended range candles, etc...). Bottom line is that there are signs the market is turning, but it takes some practice to spot them. Even when you spot them it just may mean that you should NOT trade until you have confirmation of the new trend. It's a highly personal decision and interpretation, but remember one of the most powerful abilities you have as an individual trader is that you do not have to trade. You can keep your money out until you see a trade that you just can't pass up.

I'm a detail oriented guy (just in case you couldn't tell from my blog) and I've taken to the following books for further information/motivation behind what TMTT teaches: Technical Analysis of the Financial Markets: A Comprehensive Guide to Trading Methods and Applications by John J. Murphy and Trading for a Living: Psychology, Trading Tactics, Money Management by Dr. Alexander Elder. Basically I'm looking to these books for a bit of the why behind the what. TMTT does a nice job of compressing the information down to get you successful asap, but I like to know the motivation behind the rules. I'll post some thoughts on each book soon as I continue to read.

Friday, August 18, 2006

Coaching Question From Fellow TMTT Student

I've received a few questions most every week and have chosen to privately respond directly to the sender. I'm rethinking that and will post select emails with my answer at my discretion. I'd like to take this moment to apologize for my recent delays in posts. I performed in a Wedding last Saturday and participated in a Triathlon on Sunday. Between all those activities I haven't had a lot of time to write up posts for my blog, but you'll see more regular posts again. I've been using my available time to evaluate stocks and put in paper trades. More on all that in a separate post, for now... On with the question:

On 8/17/06, Name Blanked Out To Protect the Innocent ;-) wrote:

I saw your website and it is interesting. I am in the classes also just wondered how you like it and if you have had any success yet. I have only gone to the master trader class so far and am going to attend the covered calls shortly. Just wondered when you are going to get your mentor and what package you chose. The trading room class sounds interesting so you can actually make some money. I got a call to do the coaching also however I didn't like how they were pushing me in to purchasing it, my teacher for the master trader class said it would just be a rehash of the class, I was wanting your opinion to see if you think it has helped you. I am really excited about becoming a trader but getting started is frustrating especially when trades go against you. I have been paper trading for a while and got some consistency so I did a couple real trades and they got me down because they went the wrong way. Just wanted your opinion on the classes and school.

I've been paper trading and am beginning to see some consistency with my choices. It takes some practice. If you read my post-mortem on my second update to paper trading, you'll understand how I'm learning from my past mistakes. The way I see it is that this is the best way for me to get the most of my experience. It's not simply enough to do this half-heartedly. On every trade it's important to evaluate what went wrong and what went right. A trading journal is an invaluable learning tool. I don't know if you've started a trading journal but I'll post about what I'm tracking in my trading journal soon. I'm just a burgeoning trader and am cutting my teeth with paper trades, but let me tell you, I'm managing them and thinking of the trades exactly as if they were real money.

To answer your questions about what package etc... My father and I purchased the Platinum package: 4 advanced training courses and a couple days with a mentor. Eventually we were sold an add-on package of coaching, an additional class, and another couple days with a mentor. I jumped on this opportunity, because the sales pitch was just that good. In retrospect (and gently stated earlier in my blog), although I'm very happy with the coaching I'm receiving, I'd rather have only paid $3,500 for the coaching alone, as I feel I already had purchased enough classes and time with my mentor to become a professional trader, and could eventually add the classes on with money that I make in the markets. However, I will be taking advantage of these additional courses and look forward to taking advantage of all that I've paid for.

I really cannot state strongly enough how happy I am with the coaching. It's a weekly call that helps keep me in the rhythm of trading and also gives me an experienced trader to ask questions of. It's not just a rehashing of the Master Trader class, at least not with my coach. Having taken Master Trader has given me the foundation to get the most from my coach and he's helped me tremendously towards putting the theory and lessons learned in Master Trader into practice. It's taken the "what do I do now?" question out of the equation with a simple set of building blocks that add to my arsenal of tools to help me choose the best trades. Given the choice to do this all over again, I'd definitely choose the coaching program.

Of course this is just my opinion. Everybody has their own pace and style and the person you'll learn the most from is yourself. You may not need the coaching, especially if you manage to journal your trades at open and close. It may not be intuitive, but you can have the majority of trades go against you and you can still make money. I'm just starting to see a net positive from my positions. It is hard to take to watch trades go against you, but that's just part of the game. Having a system helps remove the emotional component which can otherwise scare you out of the market. Refining that system to meet current market conditions seems to be the way to make it as a professional trader. Consistency and discipline in your day-to-day trading routine will eventually make you the trader that you want to be.

Wednesday, August 16, 2006

Coaching Call Week 8

Today coach Rob and I reviewed Chapter 6: Intermarket Analysis. Although we did go through the chapter, the majority of our time was spent in a hands-on fashion, evaluating a couple of the stocks in my hotwatch folder. There are a number of free tools out there to aid evaluating a stock relative to it's sector, industry and competitors.

To figure out a stock's relative strength to a given sector we used SmartMoney.com's Sector Tracker . Sometimes it's a little tricky to discover which sector a stock belongs to because there isn't a clear standard. We ran into this difficulty with ORB however, by looking at ORB's competitors, the we figured that it's part of Aerospace & Defense. It's useful to know which sector a stock is part of not only to help evaluate its strength relative to the sector, but the sector's strength relative to other sectors and the market as a whole. It's yet another way to filter for best-of-breed stocks. Another benefit of drilling down into the sector is that you will likely come across another stock that you'd like to add to your hotwatch and/or trade instead of your original stock. After all, if the sector is performing well relative to the market, you may as well take a look at other stocks in that sector as it's not uncommon for the majority of stocks in a given sector to perform similarly.

After identifying the sector we used Yahoo! Finance to compare our stock (ORB) to the best of the sector. SmartMoney.com's Sector Tracker allows us to drill down into the sector to see what stocks comprise the sector. We chose the top 3 performers and entered them on Yahoo! Finance's charting "vs" feature. Yahoo! Finance allows you to enter a number of stocks to compare to the current stock (enter multiple symbols by separating them with a comma). This gives you a pretty good picture of how your stock's relative strength to its competitors.

Another handy feature that SmartMoney.com provides is insider buying and selling. It seems to make sense that if the employees of a company are actually buying shares of their own company, then the people on the inside think the value of the stock value will increase. On the surface it seems like a good indicator, however most of the time buying won't show because the stocks are given to the employees as incentive or reward, but they don't show up as a purchase. However, when an employee sells, it's most certainly going to show on the insider tracking. Consequently, you're more likely to see sell orders than buy. Once more, this information requires some interpretation.

Combine all of the above with all of the technical analysis tools, volume, indicators and last week's lesson on institutional intent and you have quite a bit more evidence to support your position & outlook for a given stock. There are no guarantees, but filling in the picture with more information can either give us a higher probability or it can be enough for us to decide to simply walk away from a trade.

No doubt that it takes some time and energy to do all this research, but it is your money and if you aren't happy with part of the picture, why risk it? There are so many stocks to choose from, it seems like good practice to choose the best-of-the-best and to not bother with the rest. Don't you think it's worth that bit of extra effort on each trade?

Wednesday, August 09, 2006

Coaching Call Week 7

On today's call Rob showed me a number of cool things. By far the coolest thing was the correlation between the MACD and the NDX (NASDAQ-100) during basically all of 2005. Check it out for yourself. Pull up a chart for NDX in 2005 and watch where you would enter and exit trades when the MACD crosses. I told you that was cool. Also notice that this strategy would not do well for you in 2006.

After that fascinating study, we reviewed some intraday charts to look for volume spikes. Paying attention to volume spikes helps you spot a great ground-floor entry to capture a bit more on the move. This does require being in front of the computer during market hours and I'm sure some practice to get down pat.

The volume spikes lead us to looking at Institutional Intent. We used The Trade Center software to pull up information on Institutional ownership and intent. You can get directly to I-Watch by clicking here. It seems pretty obvious that it is wise to heed what the big players are doing and I-Watch aids in discovering what the institutions are up to.

We then looked through my fledgling trading journal and my hotwatch lists. He provided me with some valuable feedback on the stocks that I had in my watchlist, in particular the bulls hotwatch folder. Honestly, I had some stocks in my hotwatch folder that did not belong there. It's great to have someone to give me that sort of feedback. My bears hotwatch list was far better than my bulls hotwatch and although my bulls hotwatch was embarrassing, it was great to have someone give me that feedback and keep me on track.

Monday, August 07, 2006

Paper Trade Update 2 Post-Mortem

After reviewing the trades that went against me last week, I have found several things I can improve. Of course it's easier to look back and critique a trade because you can see where things were going, but the critical statements I have of the trades are on information that I knew at the time.

Long #1 (HANS): I should have heeded an earlier exhaustion gap as well as paid attention to the declining nature of the trend. This was my biggest loss due to a gap down after an analyst report. Had I managed the gap the way I was taught, I could have shaved some off the loss ... maybe not too much, but certainly some. This is a trade I really should have avoided and probably shouldn't have been in my watchlist for the aforementioned reasons.

Long #2 (LBIX): Although this trade didn't meet the criteria that it should have upon entry and I critiqued myself earlier on all the flaws with the trade, it actually closed profitable for me. I managed this trade properly using a 2/5 EMA and got out for a profit and before it took the ~20% drop today. Although it isn't a trade I'd duplicate, I managed it well by following what I've been taught and even profited despite all the negatives.

Short #1 (AVT): Excellent trade. Perfect entry and had I not tightened my stop on the second day, I'd still be in this trade today for a small gain. I was just a little excited that I could tighten my stop, but it actually wasn't how I was taught to manage the trade. It hadn't achieved quite enough movement for me to tighten yet.

Short #2 (BZH): Would have been a good trade, but I put my entry too tight and got filled at the very bottom of the dip while it was still rallying up to the 50 day moving average. I've since begun to evaluate using a looser entry (and stop) to avoid false entry like this. If I hadn't been filled that day I would probably have kept attempting entry and would have been filled today, but the trade left a bad taste in my mouth.

Short #3 (YHOO): Honestly, I'm not sure what I was thinking when I entered this trade. It hadn't settled down after a breakaway downside gap. I should not have entered this trade.

Short #4 (BBBY): Could have been a good trade, but I was a little late to the party. I decided to enter the day after the rally pullback high because there wasn't much downside movement. This could have worked for me but the stock decided to rally up a bit more before making a proper down turn today. If I was just more patient, I would have avoided the trade and possibly entered for a better reward:risk this week.

So, what looked like bad luck to me last week now reveals weaknesses that I need to work on. These are practice trades and I'm glad to know there is room for me to improve. It's also encouraging to see that if I had not deviated from what I was taught I would be in a considerably better position today.

Friday, August 04, 2006

Paper Trades Update 2

I took a beating this week. I haven't lost all that I made previously, but I did give back about 3/4s of what I had from earlier paper trades. I'm doing a post-mortem on the trades to see what I could have improved on in my decision making process to either avoid the trade in the first place, shave a bit off the loss or even stay in the trade a bit longer for a profit (if that is even possible on any of the positions).

Between Sunday and Monday night's analysis I entered 5 new positions that looked to have good reward:risk ratios, and 3 confirmation signals supporting my position. Confirmation signals included: reversal candlestick at some previous level of support/resistance, stock pulled back (or rallied up) to a channel line or Moving Average, favorable volume characteristics, crossing Stochastics, and/or positive (or negative) Chaikin Money Flow.

To me, the market in general looked like it was heading for another downturn as both the S&P 500 and the Dow-Jones Industrial Average were hitting a previous level of resistance from about 3 weeks ago. The Bear trend does seem to be weakening after a 2/3rds retrace from the Bull move starting from the low in October of last year to the high in May, but I figured that there was at least one more good bearish move left in the market before we see true confirmation of the emerging uptrend.

Because of this read, and some nice technical setups I entered 1 long and 4 short positions. I was feeling pretty good about the bearish trades in particular but unfortunately the market decided to head back up/consolidate on Wednesday. One after another they all started to go against me and hit my entry stop-loss, only making enough of a move on the entry day to fill the order. I held out hope on a couple trades all the way until Friday, but eventually they closed for a loss save 1. The one profitable trade was a very small 1% gain. I gave it room to move but when the 2 EMA crossed the 5 EMA I closed the position.

This week's trades did bum me out a little and in response I've decided to crack open Technical Analysis of the Financial Markets: A Comprehensive Guide to Trading Methods and Applications by John J. Murphy. I've also decided to order Trading for a Living: Psychology, Trading Tactics, Money Management because I realize that even though these trades are only virtual, it really harshed my mellow, if you know what I mean. It was just a little hard to take because all the earlier ones went so well. Anyway, I'm looking forward to this further input to my trading education and will spend some quality time with the John J. Murphy's book this weekend.

Wednesday, August 02, 2006

Trading P.I.T. Session 6

The final online session of the Trading P.I.T. with Bill Keevan began with a review of the previous Options strategies we've learned. Although I thought the material was presented in an easy-to-grasp manner, there were a number of questions from the students on each of the strategies. Most of the questions were worthwhile and demonstrated understanding from the student that asked it. It seems natural to be a little confused on the finer points, and Bill did a nice job of answering each question as it arose. Because the review covered the specific entry and exit criteria, I can't simply spell it all out, but I'll include the list of strategies learned along with a brief description of their general applicability:
  • Bull Call Spread & Bear Put Spread (Trading P.I.T. Sessions 1 & 2):
    Buy ATM & Sell equal number of OTM
    This is a debit trade used when expecting a strong directional move. This spread trade reduces our downside risk and limits our upside potential.
  • Bull Put Spread & Bear Call Spread (Trading P.I.T. Sessions 1 & 2):
    Buy OTM & Sell equal number of ITM
    This is the credit trade equivalent of the Bull Call Spread (Bear Put Spread) but it has some advantages. It's ideal to hold to expiration and it tends works on less movement (which doesn't necessarily match our market outlook for a bullish move). For these reasons Bill Keevan doesn't like this trade.
  • Straddle/Strangle ( Trading P.I.T. Session 3):
    Buy ATM/OTM Bulls & Puts
    This is a debit trade where we stand to make money if the stock moves in either direction, especially on increased volatility.
  • Call/Put Ratio Backspread ( Trading P.I.T. Session 4):
    Buy more OTM options than the number of ITM Options sold (2:1,3:1,3:2,etc...)
    This is a credit trade where we make money as long as the stock moves. You have unlimited upside potential if the underlying moves in your direction or the possibility to keep the credit if it moves against you.
  • Calendar Spreads (Trading P.I.T. Session 5):
    Buy long-term option and sell short term at the same strike price (unless it's desirable to diagonalize the trade).
    Calendar spreads are a way to take advantage of stagnation in an underlying security. If the stock trades within a certain range, you can be profitable. The strategy is similar to a covered call, except that it is pure options without owning the underlying.
After reviewing the above Option strategies, Bill Keevan talked briefly about Covered Calls which lead him to the Collar Trade. A Collar trade is a very low risk (<1% possibly) trade where we own the underlying security, sell a long-term Call (similar to a covered call, but with a longer time frame) and use the proceeds to purchase an OTM put for the same time frame. This trade has a limited gain and ties up much more capital than other options strategies, but the stock can be purchased on margin since we're protected by the Put we own. This is a very low-maintenance trade that can make 20%-50% annual. The Collar trade works in a Bullish market and can be an excellent, safe way to get a nice ROI. This resembles more of an investment strategy than a trading strategy.

There is considerably more to know about the above trades that the definition of what they are. Teach Me To Trade's entry and exit guidelines are pretty easy to follow, but do require considerable analysis of the options to put the odds in your favor and limit your downside risk. In most trades you make decisions based on the cost of the option and the delta, but if you want to know the specifics you'll need to take the class for yourself ;-). Seriously, mention my name... I don't gain anything from you doing so, but shouldn't you give credit where credit is due?

Following the review of the options strategies and the introduction of the Collar trade, Bill looked through some of our suggested trades and put them into OPUS. Bill took my suggestion which happened to be the last one of the night. I had suggested a Call Calendar Spread on COF (Capitol One Financial). The initial parameters of my trade made sense according to the entry guidelines but when we used OPUS to analyze the risk graphs of other combinations of options for a Calendar Spread, a Put Calendar Spread may make more sense. Bill suggested that it may be good to reevaluate this trade in a couple weeks and use the September expiration on the sale of the short term option to see if it works for me then. It was much easier to "see" the trade (risk graphs) using OPUS. I will be reevaluating what makes sense for this trade nearer to the August expiration.

I do plan to get OPUS or an equivalent option analysis software package to really unlock the potential of options in all market conditions. I'll be keeping all of these trades in mind and have already put in a Put Ratio Backspread and am watching it develop. The world of Options & Spread trading is very exciting and I see a ton of potential that I'll tap into soon. Stay tuned!

Coaching Call Week 6

You may have noticed that last week there was no coaching call posted. I had to reschedule last week's call for personal reasons and so we picked up this week where we left off. We reviewed the money management chapter and looked over some of the current stocks I have in my watchlists.

Money management & position sizing is essential to a savvy, professional trader. While the risks associated with trading can be mitigated, any given individual trade is risky. As a trader, the goal isn't to never lose money, it's to keep the losses to a minimum while maximizing your profits. There are times when a stock will move against you, gapping up or down either for your benefit or detriment. Even if 8 out of 10 trades move in the desired direction, if the first 2 wipe out your entire account, you're done. This is why position sizing and money management are essential. By only risking a set percentage of your account (say 5-10%), you can't be wiped out on a single trade and you also will naturally diversify your positions.

I don't mean what people generally think "diversify" means. I'm not referring to diversifying your portfolio by spreading your money over several sectors. I mean to say you can diversify your positions in terms of Bullish, Bearish, and Stagnant. Since an individual stock's movement is so heavily influenced by the market as a whole, diversifying your position by spreading out your account across multiple sectors only reduces volatility. Losing money slowly is still losing money. However, you can capitalize on the market's direction by placing bearish trades or just keep your money in cash during downtrends.

Another benefit that will likely come with this sort of money management plan is that you will probably have some cash available to put into a particularly appealing trade; it's not as likely that you'll have all of your money tied up in open positions. This will leave you some available capital to take advantage of a trade that you wouldn't want to miss.

To be clear, the above ramblings are pretty much my current interpretation of things. I'd mostly credit the coaching handbook, my coach, and the teachers of the classes I've attended, but that's my take. Any erroneous or poorly understood concept can be credited to me, hopefully I don't need to apologize to my teachers.

Rob and I also talked about journaling my trades. I'm to write up some free-form text explaining my position, with an honest evaluation of my emotions at the time of the trade, etc... I'll share some highlights here in the blog, both good and bad.

Monday, July 31, 2006

Tough Trends

With the word on The Street echoing statements like: "This is the most volatile market we've seen in 30 years," I seem to be entering my trading career in very difficult market conditions. I know, my friends are asking: "But you said you can make money in any market condition: up, down or even sideways." Although this certainly is true, it does seem to be easier to take advantage of trends and directional movements. I say this mostly because I've been studying trends and looking at swing trades. Additionally, I realize that there's a different kind of analysis involved in trades that take advantage of stagnation.

You may have realized this for yourself if you read my post on Trading P.I.T. Session 5 because of the need to quickly compare the different risk graphs for the various ways to take advantage of stagnation. A Calendar Spread is a great way to make money on a stock that's expected to trade in a set range. In order for me to really unlock the power of Calendar Spreads I'm going to need some more sophisticated analysis software. I've been working out simple Excel spreadsheets for basic analysis, but it's really difficult to compare the variations on the trade without risk graphs and the ability to compare all the aspects of an option (strike price, cost, delta, gamma, theta, etc...). Being able to match the risk graph with your outlook for the stock is the idea here. It may even be that you'd favor a Diagonalized Iron Butterfly instead of a Calendar Spread in a glance with the ability to quickly compare the risk graphs.

I'll be working on getting OPUS or something to help me assess these kinds of trades. I think I'm going to stick to the original trending trades here in the beginning. I favor the Ratio Backspread for these directional moves right now because of the uncertainty of specific direction for the market as a whole. It seems like stocks are getting ready to actually move in a direction, but that direction seems unclear. Maybe August isn't the month to actually establish a trend... we'll see.

In the meantime, I've discovered Interactive Brokers' recorded webinars about Trader Work Station (their trading platform). I now know how to place a Spread now, but I'm still a little confused about entering the stop-loss position automatically if the initial order fills. Now that I know the basics of Trader Work Station I'm sure I can get an answer from a coach on the Teach Me To Trade coaching hotline or attend a live IB webinar and ask.

I have managed to open a few positions and will let you know more as they develop and/or close.

Wednesday, July 26, 2006

Trading P.I.T. Session 5

In tonight's Trading P.I.T. class, Bill Keevan presented Call and Put Calendar Spreads. Calendar Spreads are a powerful way to profit from stagnation in a stock. If you're familiar with Covered Calls, you've got a head start on understanding the basic strategy.

Without going into much detail about a Covered Call strategy, the basic idea is that you own the underlying security and sell the Out of The Money (OTM) Call for a market premium. Doing so limits your downside risk by the amout of the market premium, and if the stock doesn't move at all, you make a nice profit on the sale of the Call Option. If the stock goes down, you've offset your losses by the premium you took in with the sale. If the stock moves above the strike price, the option will be exercised; you'll make a nice profit, while limiting your risk, but will be out of the stock and unable benefit from further increases in the stock's value. You can make a nice percentage return using Covered Calls, but owning the stock ties up a considerable amount of your money and although you gain some downside risk protection, it's only offset by the amount you were paid for writing (selling) the call.

In a Call Calendar Spread we will buy a long-term Call Option (say 6 months out); this is akin to owning the stock like in the covered call strategy described above. We then sell another, short-term Call Option and take in the premium. By doing so, we don't have to tie up as much of our capital; this is the way we use the leverage that Options provide to make considerably more reward on risk. We can typically expect 4-8 times the reward on risk using a Call Calendar Spread instead of a Covered Call. In either the Covered Call or the Call Calendar Spread, we achieve maximum profits if the underlying security rises to, but does not exceed the Strike Price of the Call Option we sold. If the stock does rise above the strike price on the option we sold, we will be exercised and need to either buy back the short-term option or perform a same day substitution cover the Option we sold.

To me, this is the most complex strategy to describe profitability, especially without having a risk graph. Basically, when you combine the options in a risk graph, you'll see a range of profitability at expiration with fairly steep slopes around a peak that is centered above the strike price of the option we sold.

There are many ways to structure a Calendar Spread. Unlike a Covered Call, you can take advantage of a stagnant-to-bearish outlook by using a Put Calender Spread. The flexibility of this trade adds to the complexity. You can choose to structure the spread At The Money (ATM), Out of The Money (OTM) or even diagonalize the spread by buying and selling different strike prices. By comparing the difference in premiums between the options, you can choose which spread will match your outlook.

In order to make the most informed decision between the variations on this trade, it is a tremendous help and time savings to compare the risk graphs by using OPUS or another Options Analysis program. Of course the tools of the trade (yes, pun intended) cost you money, but consider this: If you're building a house, but are not willing to buy a nail gun, it will probably cost you more in labor than you saved on the tool.

Monday, July 24, 2006

Interactive Brokers Adventure

It was a dark and stormy night in the middle of the hottest day of Southern California's current record-breaking heatwave when I began to attempt to put my Interactive Brokers adventure down in sans-serif, mono-spaced font. I'm sure the immediate question is: Why use a mono-spaced font? Or, more likely: What does sans-serif mean? The real answer is: Stop asking silly questions! None of that matters. This is the account of signing up for an Interactive Brokers (IB) brokerage account, why are you asking about fonts? Nothing to see here folks, keep moving... If you're not interested in reading my colorful-commentary, or you're impatient, scroll to the end of this post for my executive summary.

I had already set up an account with OptionsXpress (OX) about a month earlier, but did not fund it. I did attempt to put in some paper trades together on OX using their virtual trader interface. OX's interface seems simple enough, but I have a couple complaints: 1) The virtual trading interface is not exactly the same as their live trading interface. 2) Although they're modestly priced for multiple contract options and medium-to-large lot stock orders, for small orders, they are rather expensive (even at the "active trader" rate).

Both of these are major factors in my decision to not use OptionsXpress and instead go with Interactive Brokers. I plan to take advantage of the virtual trading in exactly the same way as I'll manage my real account, so the disparity in abilities between OX's virtual trader and their live trading interface is undesirable. Also, because my account will be small to start with, I won't be able to take advantage of the multi-contract Option discounts nor large lot stock purchases, so the Cost of Trade will weigh heavily against gains and will enhance losses.

I have heard a number of complaints by non-professionals about IB's interface. Interactive Brokers seems to have gained a reputation amongst amateurs of being difficult to use, yet I have not heard such complaints from professionals. I'm a reasonably savvy computer user (ok maybe even a full-fledged computer geek), so I'm not dissuaded by a complicated interface; I'm willing to put in the time today to learn to use a powerful order entry tool for my career in professional trading. I figure once I'm through the learning curve I get to take advantage of a very nice platform for placing trades.

Without the typical negatives touted about Interactive Brokers being of any significance for me personally, the remaining reasons for choosing IB make it seem like a no-brainer. Both my weekly call-in coach (Rob Craig) and my mentor (Jordan Stokes, who I'll sit down with in mid-September) use and recommend Interactive Brokers. Both of these gentlemen are successful traders and I'm going to mimic them in the beginning as I discover my own style of trade and risk tolerance. Another huge point is that Interactive Brokers is cheap, really cheap. So cheap that Bill Keevan made the remark in one of the Trading P.I.T. sessions that he doesn't even factor in the cost of the trade into is profit/loss calculation. I like that -- the ability to be an active trader without it costing much to get in and out of positions. Also, some Option plays require 4+ legs to put the strategy together -- this could likely end up offsetting gains greatly. Interactive Brokers also has an outstanding reputation over an extended period of time (29 years) for accurate order execution.

Interactive Brokers also seems to be the choice for professional traders because they don't place artificial restrictions on your orders - things like a required distance between your stop and limit when opening a position. IB allows very sophisticated, advanced order specification and routing. It is also worth noting that they allow you to trade just about every kind of tradable security under the sun: Forex, futures, options, ETFs, etc... If it's tradable, IB has it. IB's interface may be a bit more complicated than other brokerage firms, but that's because they expose so much power and flexibility. They really give you a lot of control over your trade and with such control there is far more to know and consider when trading through them.

On a personal note about the learning curve involved with IB's trader interface: consider my background. I'm a musician and computer programmer. Neither are instant-gratification pursuits. You don't just pick up a French Horn and a week later you're performing at Carnegie Hall. It takes years of disciplined practice. With the right attitude, patience, and acceptance of the learning curve you can make great strides. Even when you get to the top of your game, music, like many things, requires diligence to keep your skills sharp. Use it or lose it. Programming is the ultimate discipline of a lazy person. On the surface you may not think so, but one tenet of programming is the desire to save time. Programmers will spend thousands of hours in order to save minutes; however, those minutes are saved by everyone, everyday when they use what the programmers were willing to spend thousands of hours creating. I'm certainly willing to put in the time to get past the learning curve and take advantage of all those very nice benefits IB offers.

Now that you can (hopefully) understand my motivation to get an Interactive Brokers account, I can recount the tale of the actual sign-up process. After reviewing the various accounts that Interactive Brokers offers, I considered signing up for an advisor account. I thought: Cool, I can manage multiple accounts from one? That should work quite well for me as I plan to manage my father's account someday too. However, I stumbled when I was faced with some questions about being considered a professional and the tax implications, etc. Also, I had a reality check moment where I realized it was probably a bit ambitious to take on an adviser's account before having actually placed even a single trade. Even though having an adviser's account is likely in my future, I was getting ahead of myself.

After identifying that I desired an individual account, the details behind that account must be filled in. As mentioned, Interactive Brokers allows you to trade all kinds of markets and commodities. It seems like a simple enough decision: I want it all. I signed up for access to everything they offer, and supported the fact that I can be trusted with such access with all the necessary details. To avoid any unnecessary delay or rejection, I may have been slightly embellishing on some of the details of my experience with the different types of markets. I take full responsibility for my usage of such access, and stand by my stated experience. Please understand that I'm not advocating lying about your experience or net worth to bolster your account access; doing so can lead to many interesting ways of losing your money and may be considered a punishable offense.

It took hours to read through the roughly 40 legal agreements concerned with subscription and usage rights and disclosure of inherent risk of all the various types of markets and trades. After 4 cups of coffee, I was nearly through half and decided to take a break. There's only so much legalese I can take before the words are just a blur moving by in the background while I fantasize about... Wait, what was it that I just read? ... You get the picture. It was important for me to read and understand all of the agreements, and there were so many because of the level of access I was requesting. Make no mistake, setting up a brokerage account is not a casual thing that you should do for fun at the end of a long day.

The next step after reading through the agreements was to actually fund the account. Interactive Brokers required a minimum of $5,000 to fund my account (remember, I signed up for it all, including margin, etc... the minimum may be different for other types of accounts/access). As far as I could tell, you cannot move forward from this point until you set up the funding. That is, no paper trade acces, nothing... They seem to want serious customers, not lookey-loos. After I send the ACH payment, I scanned my driver's license and emailed it in, as proof of who I am and where I live. It seems all brokerage firms require some proof of who you claim to be and where you live. About a week later my account was activated. Immediately after, I asked for a paper trading account to be created for me to virtual trade. It took another few days for the virtual account to become active and now I have my account set up, funded and ready to trade.

Executive Summary (for the impatient):

Positives for Interactive Brokers:
  • Powerful capabilities
  • Trade many different markets
  • Cheap!
  • Reliable
  • Well-established brokerage firm
  • Virtual (paper) trade interface exactly same as real trade interface
The only negative is the opinion amongst casual (or amateur) investors is that the interface is difficult. I've begun using their Trader Work Station (TWS) software and although I don't know all the ins and outs, find nothing worth complaining about. As I learn how to use their TWS software for trade execution and management, I'm sure all the abilities they provide will be very desirable and much appreciated.

Saturday, July 22, 2006

Efficient Market Theory

Recently I read StockCharts.com's Stock Analysis Overview, which is part of their free Chart School Educational Information. I've been reflecting on the concepts presented therein and it's helped me understand the principles behind much of what EduTrades, Inc. (Teach Me To Trade) teaches. As noted, I'm new to stock & option trading and I'm doing all I can to soak up more information and opinions. Although it's not the only thing TMTT teaches, technical analysis is certainly paramount to TMTT's system of trading. Technical Analysis should be incorporated into any investment strategy for trade entry and management, but it's absolutely essential to being a Professional Trader.

The overview is a presentation of theories that are the basis of a trading or investment system designed to "beat the market." There are scores of people on wall street and around the world that are attempting to do just that. It seems logical that the way to beat the market is to exploit anomalies that exist at any given point in time. So how do you know what's anomalous? This is one area where technical analysis excels. If your technical analysis leads you to believe that a particular security is overbought or oversold, you can enter a position to prosper from the anomaly. Now that sounds all well and good, but it does require accepting Strong-Form "Efficient" Market Theory as a foundation.

Simplistic as it may seem, strong-form theory states that everything you need to know about the company is reflected in its current price because that's the value the market has dictated. Technicians look to trends and patterns in the chart & volume to make money on overbought or oversold stocks. For an efficient market to work, investors need to know all relevant information, including news and fundamentals about the company; investors must also have the ability to act (or react) to such news as quickly as possible. Essentially the price will continually correct itself as news and company information is made available to the public.

The other theories for and exploiting anomalies include the semi-strong form and the weak form. The weak form of the market dictates that the fundamental information behind a stock determines its actual value. The discrepancy between the current price and the expect value based on your fundamental analysis is the anomaly that we can exploit. For example, if your fundamental analysis leads you to believe the stock is underpriced relative to it's value, you'd be bullish on the stock and seek to profit as the trading price approaches the value that you've determined from your fundamental analysis.

Although I don't think this approach is worthless, there are many times the price of the stock does not react the way you might expect. When good news comes out about a stock, this system dictates the price should increase, but there are numerous examples of the exact opposite happening if not nothing (no increase) at all. Even if you were a fundamentalist who whole-heartedly subscribes to the weak-form market theory, knowing a good technical setup can certainly benefit your bottom line.

The most interesting theory (yet the most worthless for the basis of a trading or investment system) is the semi-strong form of the market, aka the "random walkers." This theory basis itself on price corrections happening (much like the strong-form theory), but that the only way to profit from such price corrections is to know the news ahead of the public at large. The idea behind this is that, although all known information available is reflected in the current price, there is inevitably information that is not public (think insider trading). Without such insider information, the markets behave in a rather chaotic, unpredictable way. Thus making the ability to "beat the market," a near impossibility without insider information. I don't believe this is the only way to beat the market, however I do believe a certain level of insider trading does exist. I say this only based purely on human nature; I'm not so much an idealist, nor so naive that I believe everyone is honest and forthcoming all the time, especially when they stand to profit from withholding such information.

Granted, I'm new to all this, but it seems the market has become more efficient as the delivery of news and the ability to act on that news has become more immediate (and cheaper). Therefore, in today's world of up-to-date news available at the click of a mouse, and the ability to act on that information with similar speed and ease, we have a more efficient market than we've had in the past. It also seems realistic to expect that the markets will become more effecient and possibly more predictable. Consider if everyone is using the strong-form (effecient) theory to determine their trade entry & exit; in such a situation, the stock should exhibit a normalized, semi-predictable behavior. Of course this could all just be in my imagination as I conceptualize how trading & the markets work.

Wednesday, July 19, 2006

Trading P.I.T. Session 4

Tonight's Trading PIT class with Bill Keevan was about Ratio Backspreads. We covered both the Call Ratio Backspread and the Put Ratio Backspread. This is a credit trade where we are expecting a strong directional move in the stock. However, if the stock moves against you, you still come out ahead. Let me give you a moment to think about that. If you are dead-wrong on the direction the stock is going, you can still make money. Isn't that a nice trick? There is a downside: if the stock just consolidates and doesn't move either direction before the options expire, you stand to lose money.

This strategy involves simultaneously Selling an In-The-Money (ITM) Call (or Put) Option and using the credit to Buy 2 or more Out-of-The-Money (OTM) Calls (or Puts). There is a lot you need to know about the Options in question in order to make this trade work for you. Again, this is one of those times I can't really tell you a lot about how to structure the order, you'll need to take the class so that I don't reveal the proprietary entry & exit criteria.

I have created an Excel template for a evaluating a Ratio Backspread. It allows you to quickly evaluate the entry criteria, by comparing 3 ITM contracts to 3 OTM contracts and allows you to change the number of contracts to Buy and Sell. Unless you have taken the class, you may not understand how to use it, even if you have taken the class, you may not know how to use it. I just created it to help me evaluate Ratio Backspreads for myself. If you're interested it can be downloaded by clicking here.

Coaching Call Week 5

This week Rob reviewed both chapters 4 & 5 with me. Chapter 4 is on trends, chart reading, and Moving Averages, whereas chapter 5 is on Stochastics & MACD. One point Rob drove home with me is that secondary technical indicators, such as Stochastic & MACD are used for confirmation of our position on a stock, not as a deciding factor. Something like evidence to support your position, but that your stance on a given stock is based on the current chart, looking for trends and support & resistance.

Today, for some unknown reason, we had trouble with NetMeeting so he was unable to connect to share my desktop like we have done in previous sessions. Perhaps my cable Internet provider was having trouble or something.

While we were working on getting NetMeeting to work, I managed to ask a question I should have asked earlier. I asked Rob about why, in his opinion, do 85% of traders quit within 6 months of trading? This was something he informed me of on our very first introductory call (see: Coaching and Catches). His answer was that most lack the discipline to improve and make it as a trader. I drilled into that statement a little for a clarification about what is meant by being a disciplined trader. In essence: maintaining a watchlist, waiting for the best opportunity to make the trade, and managing the trade. I can see how this isn't the easiest thing. For those of you who think this is "easy money" well... think again. You can't just do this as a hobby or casually. It requires a lot of time, effort & concentration.

After a review of the chapters we looked through some of the stocks that I have in my Hotlist and the position I currently have open on a Paper Trade. I was a little embarrassed for the position I currently have open on a paper trade. Although the trend looks good, it's volatile, cheap and trades thinner than normally preferred. Has the feel of an amateur trade. It's not something I'll repeat in the future, especially given that it's a bullish trade on a decently trending stock, but with the market bearish. I may be being to hard on myself though, but I don't plan to trade something like this again in the future, paper or otherwise. I'm learning, so mistakes are inevitable. This trade may work out, however I'll consider it luck more than skill if so.

Next week we'll be reviewing Chapter 7 and I'm to continue maintaining my hotwatch list, watchlist in general and to continue to paper trade.

Tuesday, July 18, 2006

Master Trader Session 6

This evening was the last of six Master Trader Sessions with Matt Gildea. I was just a little late to the start of this class. I had my cat fixed today and the vet was very slow to bring my Wannabe back to me. I ended up waiting 15 minutes for them to bring her out. Needless to say that was frustrating and made me 8 minutes late to my class! When I joined the meeting I came in on him demonstrating Order Entry in OptionsXpress.com

After the order entry we reviewed some current setups and talked about order management, especially stop management. Matt showed us several home builders' charts as they've been a terrific sector to short during the past few months.

After looking through these current market items, we looked at some essential Market Gauges. We began with the "Original Formula" Volatility Index (VXO, $VXO, ^VXO, often just pronounced: vix). This seems to be one of the most powerful leading indicator gauges at our disposal. For much of the past 5 years this has been an excellent tool to measure market sentiment. The best part is it really has demonstrated itself to be a fairly consistent leading indicator of market direction. However, more recently, although it hasn't been completely wrong, it just hasn't given the kind of clear signals it has shown in the past. Since general market sentiment affects stocks, this is a very powerful tool to aid in our decision of an individual stock's direction. Compare the VXO to the DJI, S&P, Nasdaq for the past five years for yourself and see what patterns emerge. Notice how the VXO hasn't moved as dramatically in the more recent past and how the market has similarly not has as dramatic a movement following the VXO's movement?

Although the recent volatility index range has been a bit muted it still follows as a leading indicator if you squint with one eye and turn your monitor sideways. No, just kidding, I was checking to see if you are still paying attention. It seems that all indicators must be continually reevaluated for their applicability to current market. Although this may seem to invalidate them, I think we'd be throwing the baby out with the bathwater if we took that approach. By keeping an open mind to a different interpretation of these indicators, we can still find use of these to aid our decision making on any given position. I may be reading too much into this, and the above account isn't exactly echoed from what I've been taught. It's my own interpretation of what has been presented to me. You've been warned.

After looking at the vix, we went through some guidelines on managing a gap open on our setup as well as how to manage gaps on our open positions. Some of this information requires that you are able to be in front of your computer making market decisions in realtime during the opening minutes of the market. Not exactly day trading, but certainly some strategies involve a similar discipline.

We then turned our attention to Relative Strength & Weakness stocks. Determining relative strength & relative weakness for a given stock is yet another way for us to support our opinion on a stock's direction. This is a multilevel filtering technique we apply where we compare the stock to the market as a whole (an index, such as the S&P 500), and the specific sector. It does make sense that you'd want to put your money into the strongest performers of a given sector that is ideally the strongest performing sector at that point in time (or reverse that for bearish or short-sale). I think this is a very important aspect that I will include in my analysis of an individual stock. It's not the easiest thing to analyze, but I think the benefits far outweigh the time cost.

Matt Gildea then spoke about what the daily routine of a professional trader is. You may have already picked up on this being a discipline that requires daily attention, but this point really can't be stated strongly enough. This is not something that you can expect to get tremendous results by doing it as a hobby, there is a daily routine that you really requires some time. You must be aware of the current market environment, pay attention to news reports, maintain your watchlist, continually be looking for new positions to open and manage the existing positions. It probably means a couple hours a night with some attention paid to the market just before it opens and ideally checking on your open positions as the day progresses to evaluate if any of your stops should be updated.

After having all this information spinning around in my head, it's going to take some practice to get it all down. Right now I'm moving a little on the slow side in terms of analysis & finding trades that I'd want to put my money into. I'm practicing the daily ritual with my paper trades, but there is quite a lot of analysis and things to consider. Patience and keeping a cool head seem to be vital to success.

Monday, July 17, 2006

First IB Paper Trades

Sunday night I identified 2 stocks that looked like they had a reward:risk of > 2:1 and set up the trades on my Interactive Brokers Virtual Trading (paper trade) account. They've given me 1 million dollars in the account and I don't know if I can change the amount or not. I've considered reducing it to what I'll really be trading with for the most accurate virtual experience, but have not yet found if or where I can configure the "funding" of my virtual account.

The first stock I set up for shorting dropped down just enough to fill, only to increase enough to stop me out for a small loss. No big deal, looks like it was going against me anyway, so may as well just get out.

The second looked like a decent setup but normally would not have been filled today because it didn't drop below the entry threshold. However, because I didn't know how to set the conditional activation of the stop-loss I ended up long on a stock that I wanted to short! Oops!!

This is why we practice with paper money, right? I know it's not a mistake that I'll repeat and I have since located the conditional aspect of an order. The ability to set conditions on the order is considered an advanced feature that Interactive Brokers "hides" early on to simplify the interface. Rather than just panicking and closing out the position, I decided to protect from it dropping below a certain threshold where it seemed to have found some intra-day support. Hopefully tomorrow it will inch up back to where I falsely entered the long position.

Tonight, after going through my Hotwatch list I couldn't find any trades that looked like high enough reward:risk ratios to bother so I didn't enter any new paper trades. I'll be paying attention to that second stock that I accidentally went long on to see if I can exit with only a small loss or possibly even a gain.

Sunday, July 16, 2006

The Fresno Paper Trades

Remember those dozen stocks that my father and I identified as possible shorting candidates when I was in Fresno? Well, I got to thinking: what if I entered the trade and managed it (stop-loss) as I've been taught. This meant going through the charts on each of the dozen that we had on our watchlist, plugging the numbers into the spreadsheet that Matt Gildea gave out as part of the 2nd Session of Master Trader to evaluate the reward:risk ratio. Out of the 12 stocks that had good technical setups, 6 had a favorable reward:risk ratio of > 3:1 at the time.

I was really interested in the untainted, unadulterated truth about how effective this trading system is, and therefore made these back-dated paper trades based only on the information the stock was giving up to that time. That is, I didn't look to the future to make the decision. That would ruin the results, and although it may be good for my ego, it certainly wouldn't do much for feedback on my system of trading.

Following the system, 3 (CLE, CPKI, CNB) out of the 6 were stopped out for meager gains, one probably would end up being a very small loss given the disparity between the Bid and the Ask. Obviously there's a problem with stocks that begin with the letter C, so I'll avoid them in the future ;-). One more (EBAY) would have been stopped out for a nice gain of 6.75%. I actually re-entered trades on EBAY, CLE, and CRL because the re-entry looked good, and am currently holding those in addition to the remaining 2 (PLL & STN).

The bottom line is it averages out to roughly 3% (on amount risked) in 2 weeks using straight stock trading (not options). A very promising beginning to my paper trades. I'm now current and will not be back-dating any of my paper trades in the future. I placed 2 trades on my Interactive Brokers account, which will hopefully be filled tomorrow. Now that I don't have the ability to see the future direction of the stock, the truth will be unavoidable. Along with the truth I can tailor my trading style to suit my risk tolerance as I get a feel for actually entering and maintaining my (paper) trades day in and day out.

Thursday, July 13, 2006

Trading P.I.T. Session 3

Tonight's Trading P.I.T. class with Bill Keevan covered the Straddle/Strangle option strategy. This is a neutral debit strategy where you make money if the stock moves either up or down. Without covering the specific guidelines TMTT teaches for entry and exit, the basic idea is that you buy a Put and a Call before expected volatility in a security. Of course if you think really hard about stock behavior, you may be able to predict increased volatility around specific, predictable events. I'll let you think about which events repeatedly produce such an increase in volatility so you feel like you've earned the answer.

This strategy is one where you can make money, typically 100% of what is at risk in the trade. However, if the stock does not move, you stand to lose money. It's important to make a distinction between how much is risked versus the total cost of the trade. We won't be risking the total cost because we'll only be holding the Call & Put for approximately 1/4 of their expiration time. Hence, if the stock's volatility decreases and it just consolidates or trades sideways, we will primarily be risking the decrease in value of the Options due to lower volatility. Option value is derived from volatility, so if there is a decrease in volatility the value of the options that we've purchased will also decrease. Theta decay (time decay) will also account for some of the money at risk.

I know this sounds fantastic, right? Make money no matter which direction the stock goes!?! It is a very cool trade, but let me tell you that there are a number of aspects that you need to pay attention to in order for this trade to work, and if you don't know the guidelines you can easily spend too much on the trade relative to the reward. You can also set yourself on a biased position instead of a neutral position. If you wanted to put yourself in a biased position, there are better trades to capture a directional move. As you would expect about pretty much any Option Strategy, you need to pay attention to the Option Deltas. This is a volatility trade and you must also take Implied Volatility into account. Also, like most trades, you need to take a look back into the history of an underlying security to help forecast the future to ensure your success. TMTT gives very clear guidelines for what the Net Delta should be for an ubiased position, as well as entry criteria based on Implied Volatility.

Tonight's class helped point us to some resources for identifying potential stocks to trade using a Straddle or Strangle Option Strategy. This isn't the easiest concept to grasp, but it shows just how powerful and flexible Options can be. I look forward to trading a Straddle/Strangle soon, but it seems this class was just a little late for taking advantage of this trade this quarter, however I will be looking for a current setup for this trade and hope to find one that will work for a paper trade. Stay tuned, it's starting to get interesting, isn't it?