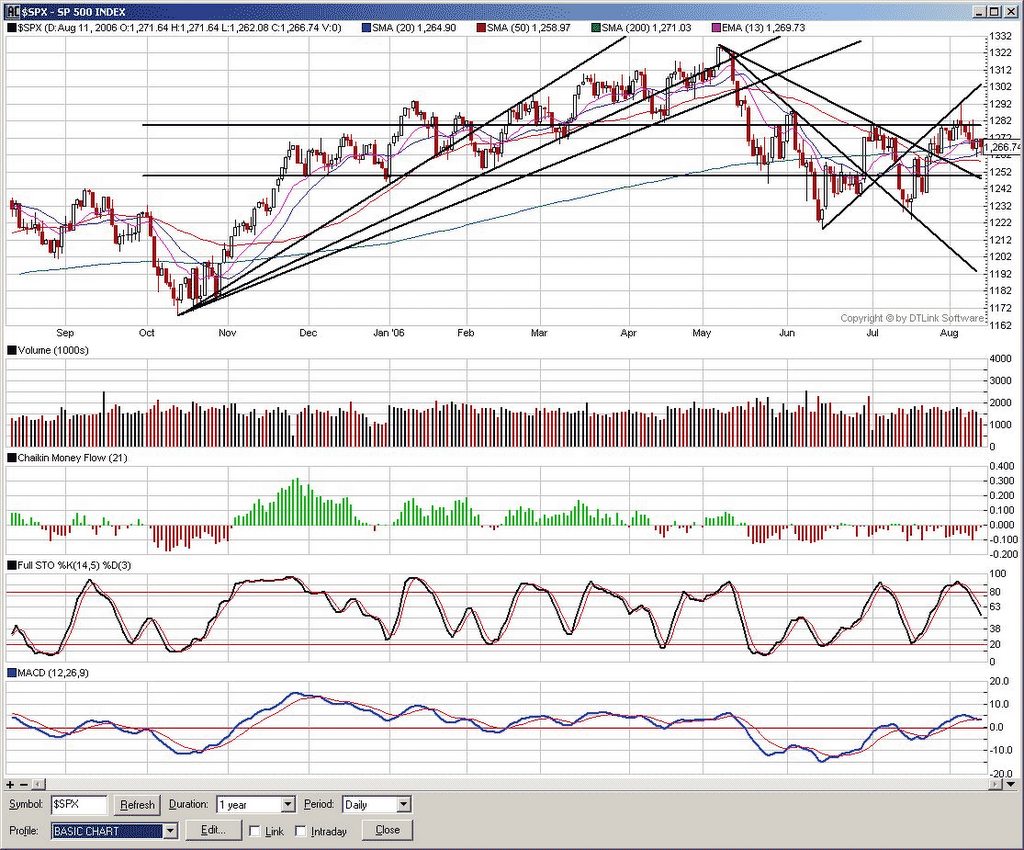
 On the right is my analysis of the S&P 500 10 days ago (August 11, 2006). I drew in the 3 ascending trendlines following the Fan pattern that Murphy describes in his book. Another idea that Murphy brings to light is 2/3 retrace. Simply stated: we can expect a 1/3 retrace from the low to the high, however if we fall through that we may find support at 1/2 way down from the peak, and after that 2/3 way down. What you'll notice on the S&P 500 over the last year matches this pattern pretty well. Notice that there's basically 150 points between the low in October to the high in early May. Interestingly enough, there's a bump at the halfway point on the retrace in mid May. After the market crashed through that level of support it retraced down almost exactly 100 points to find support 2/3 down from the peak to early-to-mid June. Take a really good look at the trendlines I've drawn in. They are initially drawn along the line of support on uptrends and resistance on downtrends, but notice how once the trendline (support) was violated it became resistance. This is especially true of the first trendline for both bottom (uptrend support) & top (downtrend resistance).
Because of this purely technical market analysis, two weeks ago I was expecting the bear market to be weakening and that we may soon see a bull market. At the time of the analysis (August 11) it was not exactly a certainty, and I honestly expected some consolidation before we actually see a true uptrend. However, it has lead me to favor my bulls watchlist for long positions that currently have a good setups, rather than continuing to be weighted towards the bearish side.
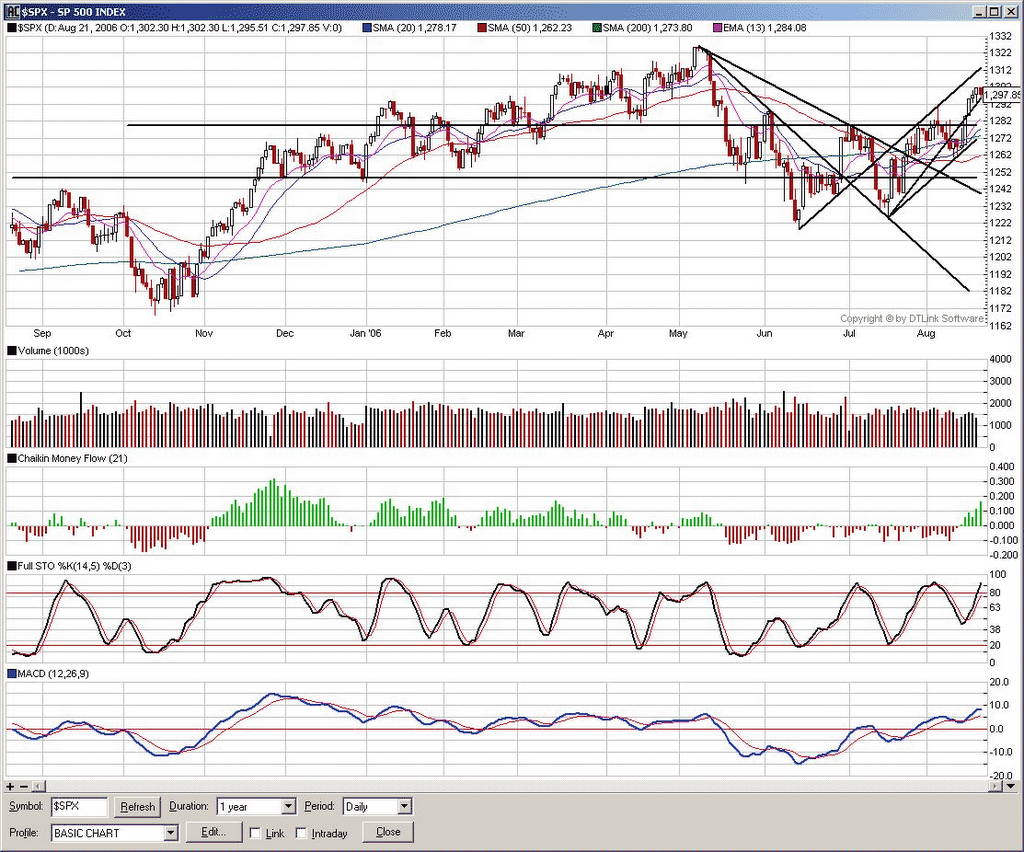 Here's an updated chart for the S&P 500 as of today. I've drawn in all the same forward-looking lines as was in the previous version, adding a couple new trendlines showing current market trend. These are not very well established, and because August's history as being a bad month (August Angst) a great number of people expect it to be the worst month of the year. The S&P 500 has managed to show some signs of predictability, but from a purely technical analysis, it's a time to be cautiously optimistic IMHO.
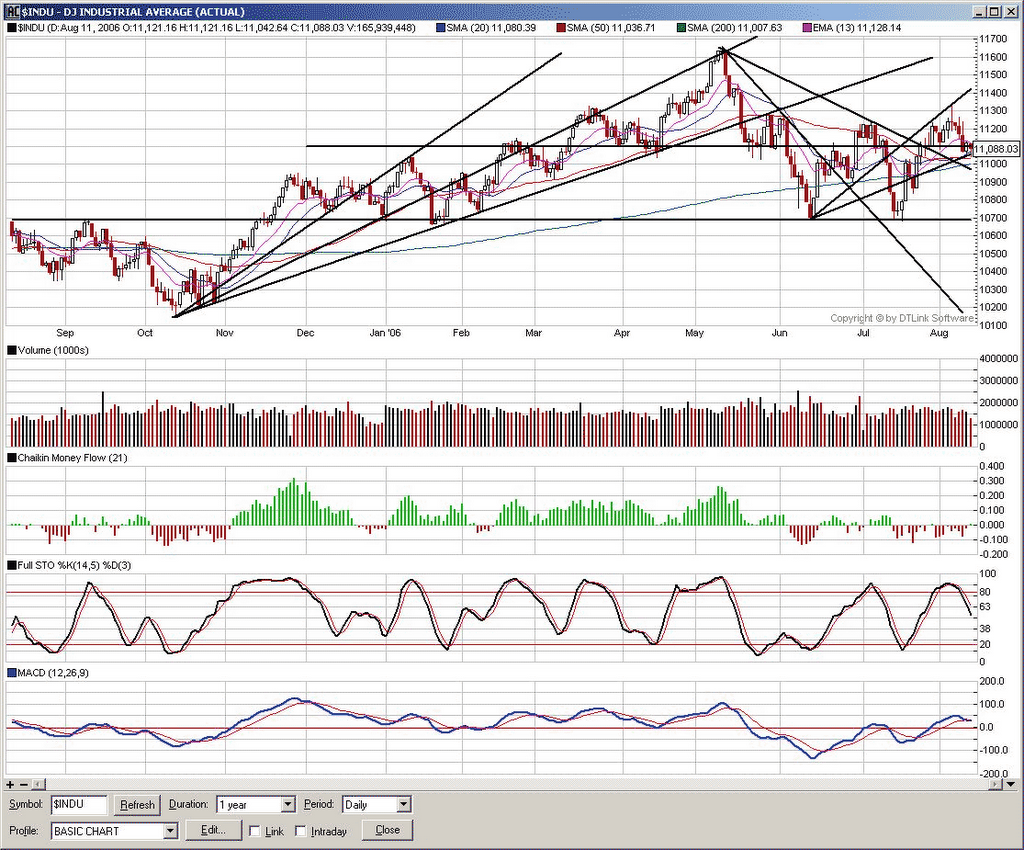
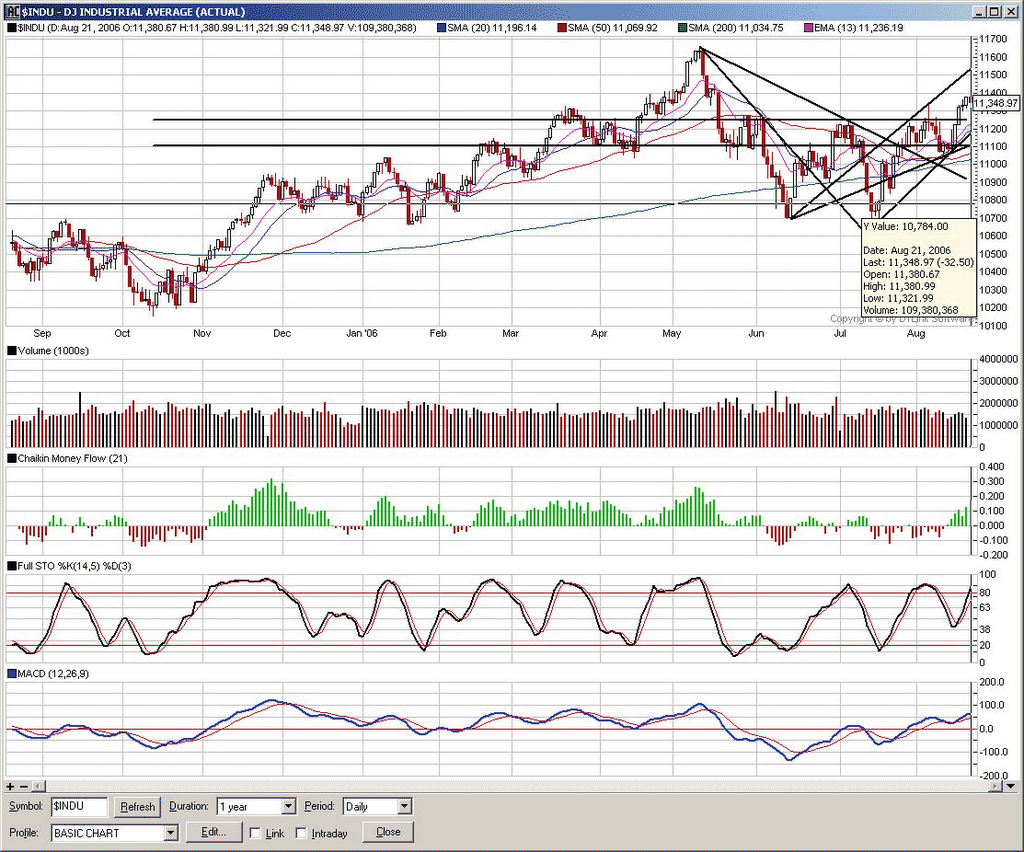
Below is a similar study of the Dow Jones Industrial Average. Notice how many of the same phenomina appear on the DJI as the S&P.
Please consider your source carefully when taking anyone's opinion about the outlook for the markets and/or stocks; after all, if you're taking my interpretation, allow me to remind you that I haven't even placed a trade with real money yet! I just wanted to let you see an example of how I'm looking at the market to help determine my positions. All of the above is only my interpretation & opinion, so be especially skeptical! I hope that in the future I can look back at this post and either 1) be proud of my decent interpretation or 2) laugh about how I could have such an outlook based on the charts because my technical analysis skills are so much better.
This post resembles a trading journal entry in many ways and it is part of my journaling activities. I'll give an example of my trading journal soon. As in music, the best person to learn from is yourself; it does require that you keep a certain detached, honest perspective in order for you to learn from your strengths & weaknesses. In music, the sound you produce is your ultimate goal and a mic is brutally honest and allows you a external perspective of how effective your efforts are. Listening to the playback with an impartial ear is one of the most effective self-teaching tools available. A trading journal is a way of capturing your thoughts, justifications, emotions, etc... at open and close of a trade. It gives you insight into your own trading strengths and weaknesses and thus is a learning tool that's custom tailored to you.


1 comment:
Hi Mark
I thought about attending the 2 hr trading course on the outside chance that I would learn something new. They will be in Independence Mo tomorrow and I considered calling the 800 number. After reading these and other posts there is no chance I would waste two hours there. I am quite familier with high pressure sales organizations whos' real purpose is to take advantage of the weak, elderly and uniformed. This "trading seminar" smells like one of those scams. I would probably lose my cool when they high pressured me.
I am a casual options player and have been for almost 30 years. The DOW was at 500 when I started trading in the 70's. Todays' computer analytical capabilities were only dreams back then. Sure, you could buy or rent a "Bunko" machine if you could afford it. Other than calling your broker, a Bunko machine was the only way to get real time quotes. If you were playing options, your discount broker quickly became you best freind. I wish I had todays computer tools back then! That said I'm still no expert. Over the years I am a little ahead of the game but GREED and IMPATIENCE generaly kills my huge hits.
I see no need to buy expensive stock analytical programs when you can get one for free from Ameritrade. I use TD-Ameritrade as my broker and they have a very powerful tool called "Advanced Analyzer". One needs to try it to beleive it. Because I am an active trader I have an APEX account and get to use the Advanced Analyzer for FREE! How's that for a good price? Advanced Analyzer is a tool that identifies "trading opertunities" by whatever criteria you desire. It has many built in pre-defined alert criteria groups -100's of them. Some with glamourous names as "Penny Stock Poppers", "Fundamental Plays", "weak plays", Strong Plays". Or you can user defined any kind of play you desire. As with ANY worthwile program, Advanced Analyzer requires that one spend some time with it to learn its' capabilties.
Advanced Analyzer can be used by the stock player with just basic needs such as real time charts and quotes. The advanced user will find many neet features he can apply to track stocks by standard methods or virually any user defined criteria. After studying and using this free program I see no reason to spend any money for any other. And why pay an additional $40 per month for streaming quotes when you get that for free with an Ameritrade account???? Why? Because a novice investor doesn't know what's out there.
About options. From Advanced Analyzer you can directly link to the CBOE (Chicago Board Option Exchange) and download option history in comma delimited ascii test files straight from the source. Drop the text file into Excel and write your own historical criteria. Make your own option charts. Delayed option quotes and option chains are accessable through Advanced Analyzer. Want real time option quotes? Real time option and stock quotes come straignt out of the free "Streamer" program you get when you are an Ameritrade customer!
It took me a couple of days of playing with the program to get the feel of it. It's likely I'm just scratching the surface of Advanced Analyzers capabilites. I would be interested to know what you thought of it compared to the expensive program you are using.
Presently I am playing Ford Jan $9 call options FAL-E and Ebay Jan $30 call options XBADF. I expect Ford to be well over $10 by January and Ebay to be well over $35.
MrLucky
Post a Comment